Section 6: Data Centre Assurance
Everything you have done so far in this lab has been within Apstra — a single fabric, managed through a single blueprint. Data Centre Assurance takes that further. It is Juniper’s cloud-based AIOps platform that connects across all your Apstra-managed fabrics, ingests telemetry and Flow data continuously, and uses machine learning to identify anomalies, correlate events across the topology, and surface root causes automatically.
|
What is Flow data? Flow data is a record of network conversations — which devices are communicating, how much traffic is moving between them, which applications and ports are in use, and for how long. It gives you visibility into what is happening on the network, not just whether the network infrastructure is up or down. Data Centre Assurance combines that traffic intelligence with Apstra’s fabric model to give you a complete picture: what is running, where it is going, and whether anything is wrong with the path it is taking. |
The demo environment you are about to access has two live blueprints already connected, both generating real Flow data:
-
SEDemoLab-DC1 – SE Demo
-
SEDemoLab-DC2 – SE Demo
|
You are not looking at static screenshots or simulated data. The environment collects and processes Flow telemetry continuously, so what you see reflects genuine traffic patterns at the moment you are viewing it. |
Signing up for the demo environment
-
Navigate to https://get-dca.osiodyssey.com/ and fill in your details.
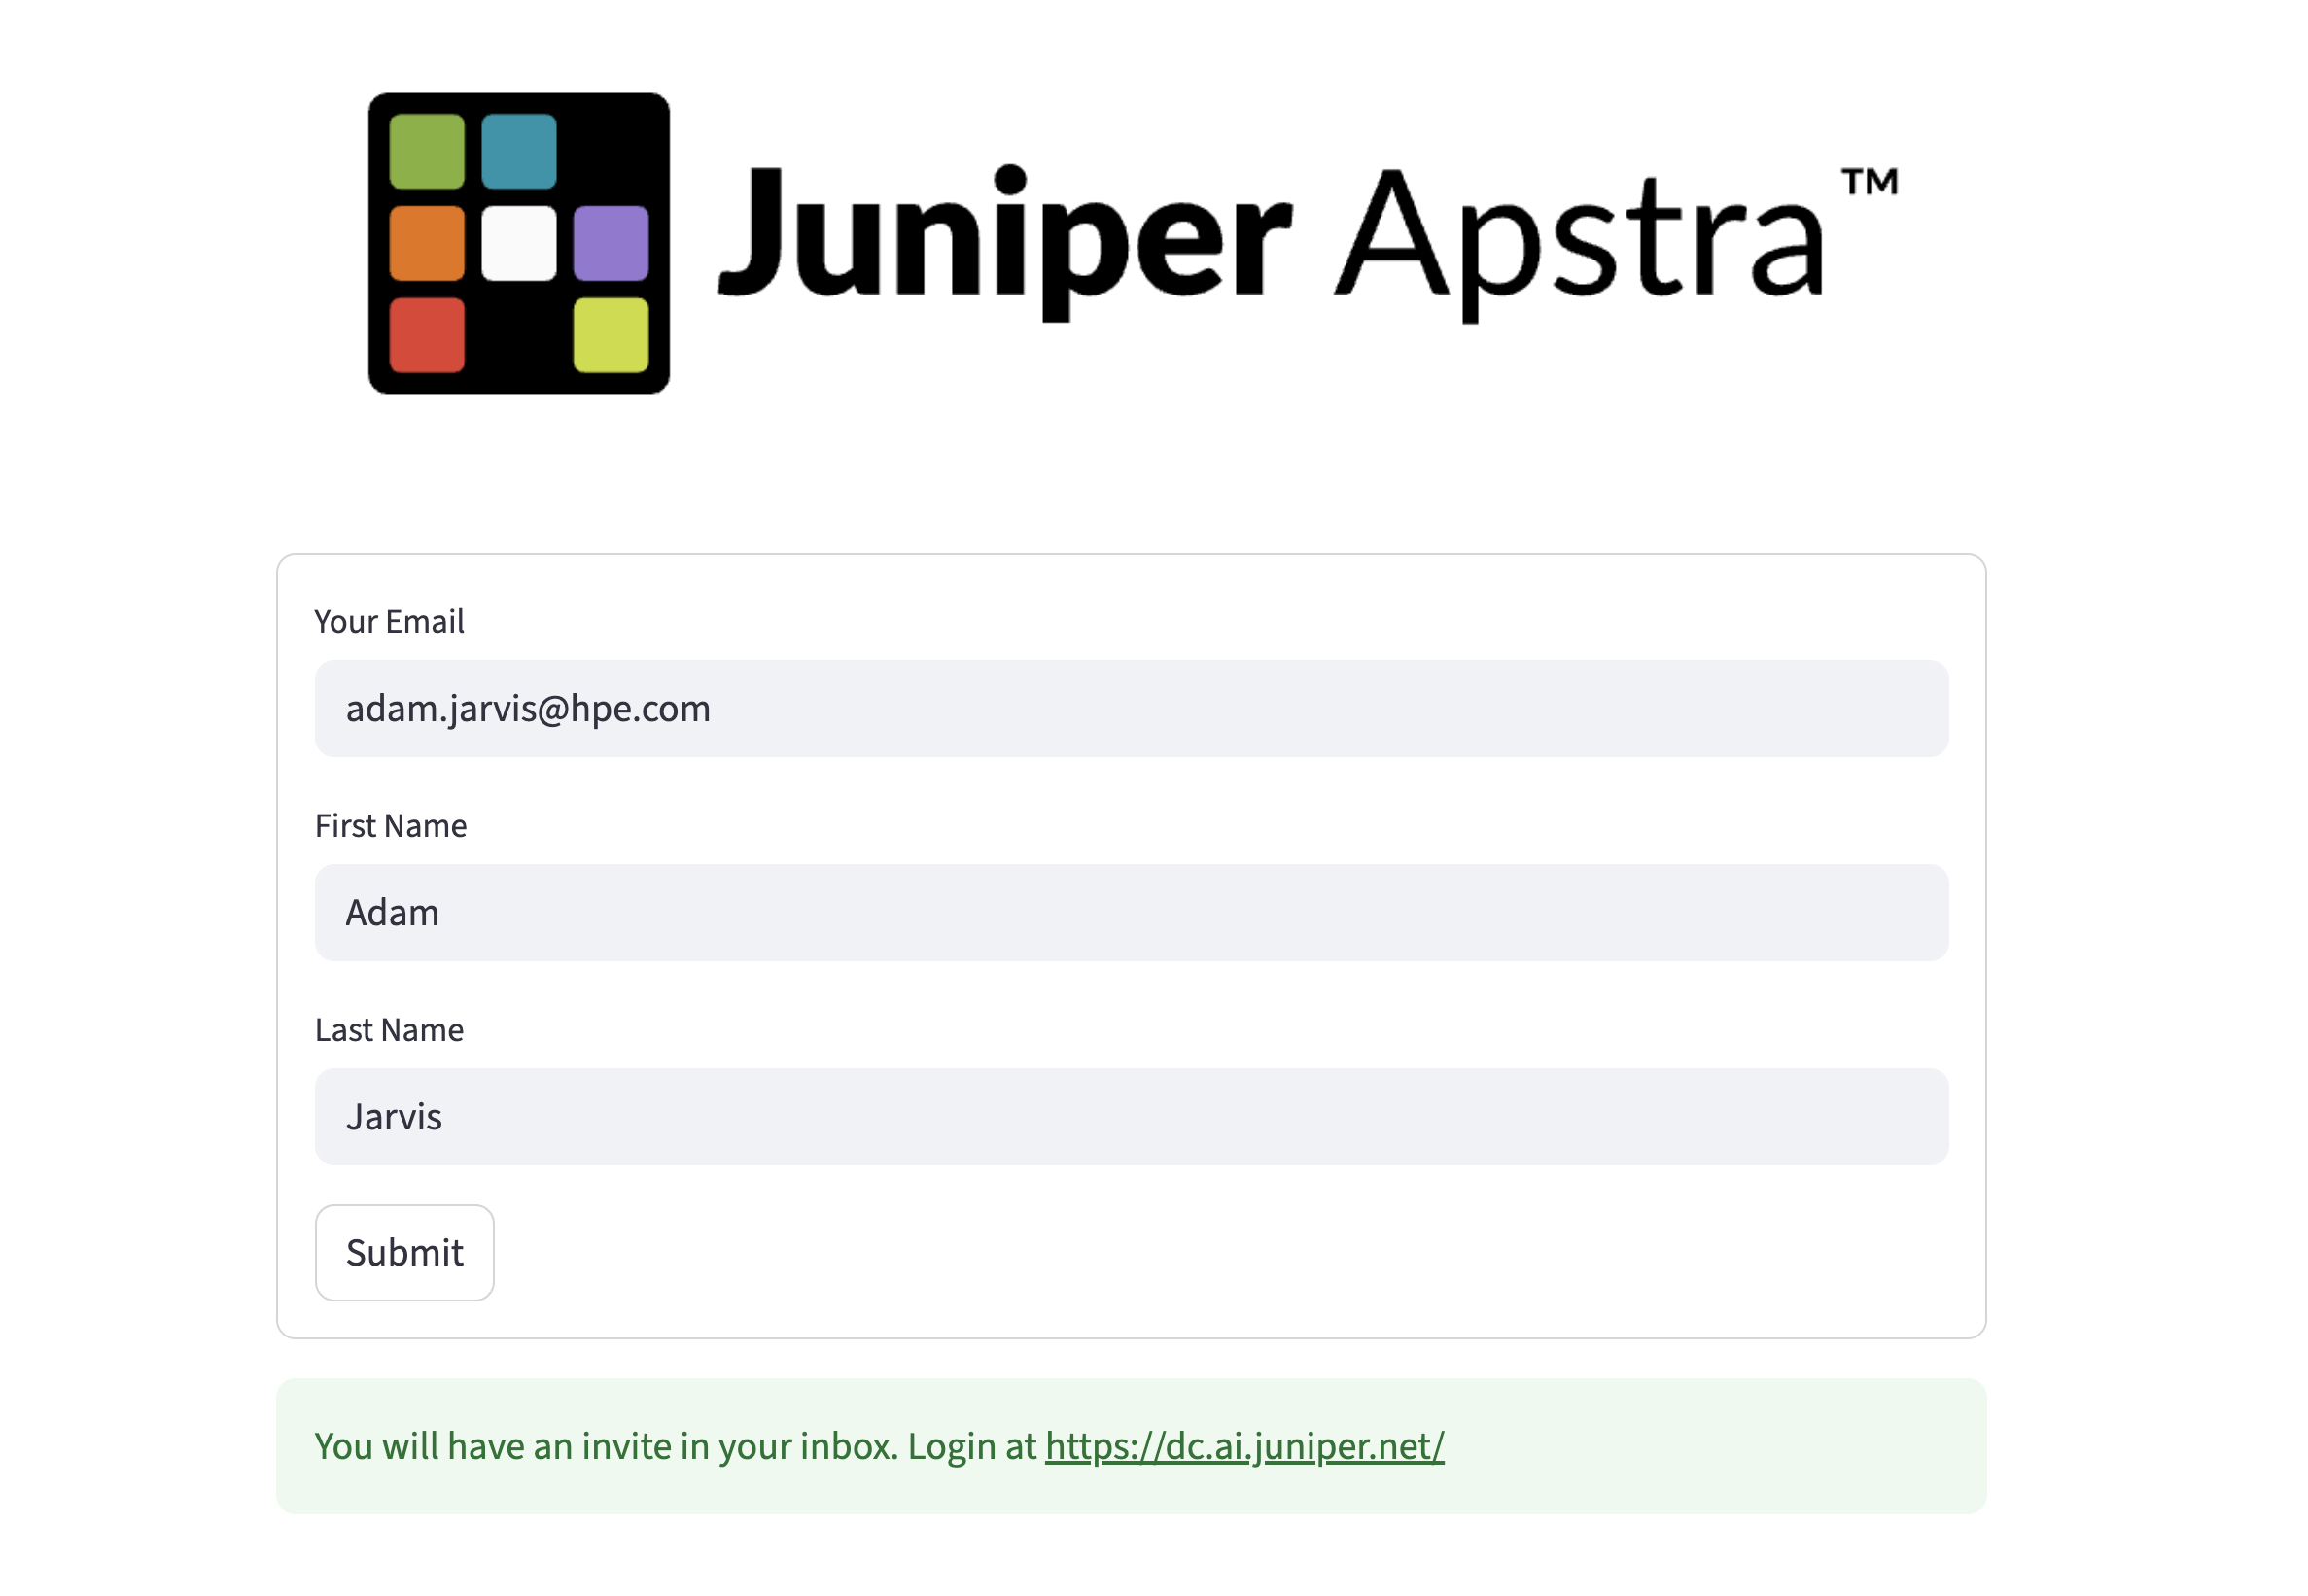
-
You will receive an invitation email from no-reply@mailservices.juniper.net.
|
Check your spam or junk folder if the email does not arrive within a couple of minutes. |
-
Follow the link in the email to accept your invitation.
-
Sign in at https://dc.ai.juniper.net and select the demo organisation from the list.

You will land on the Marvis Actions page.
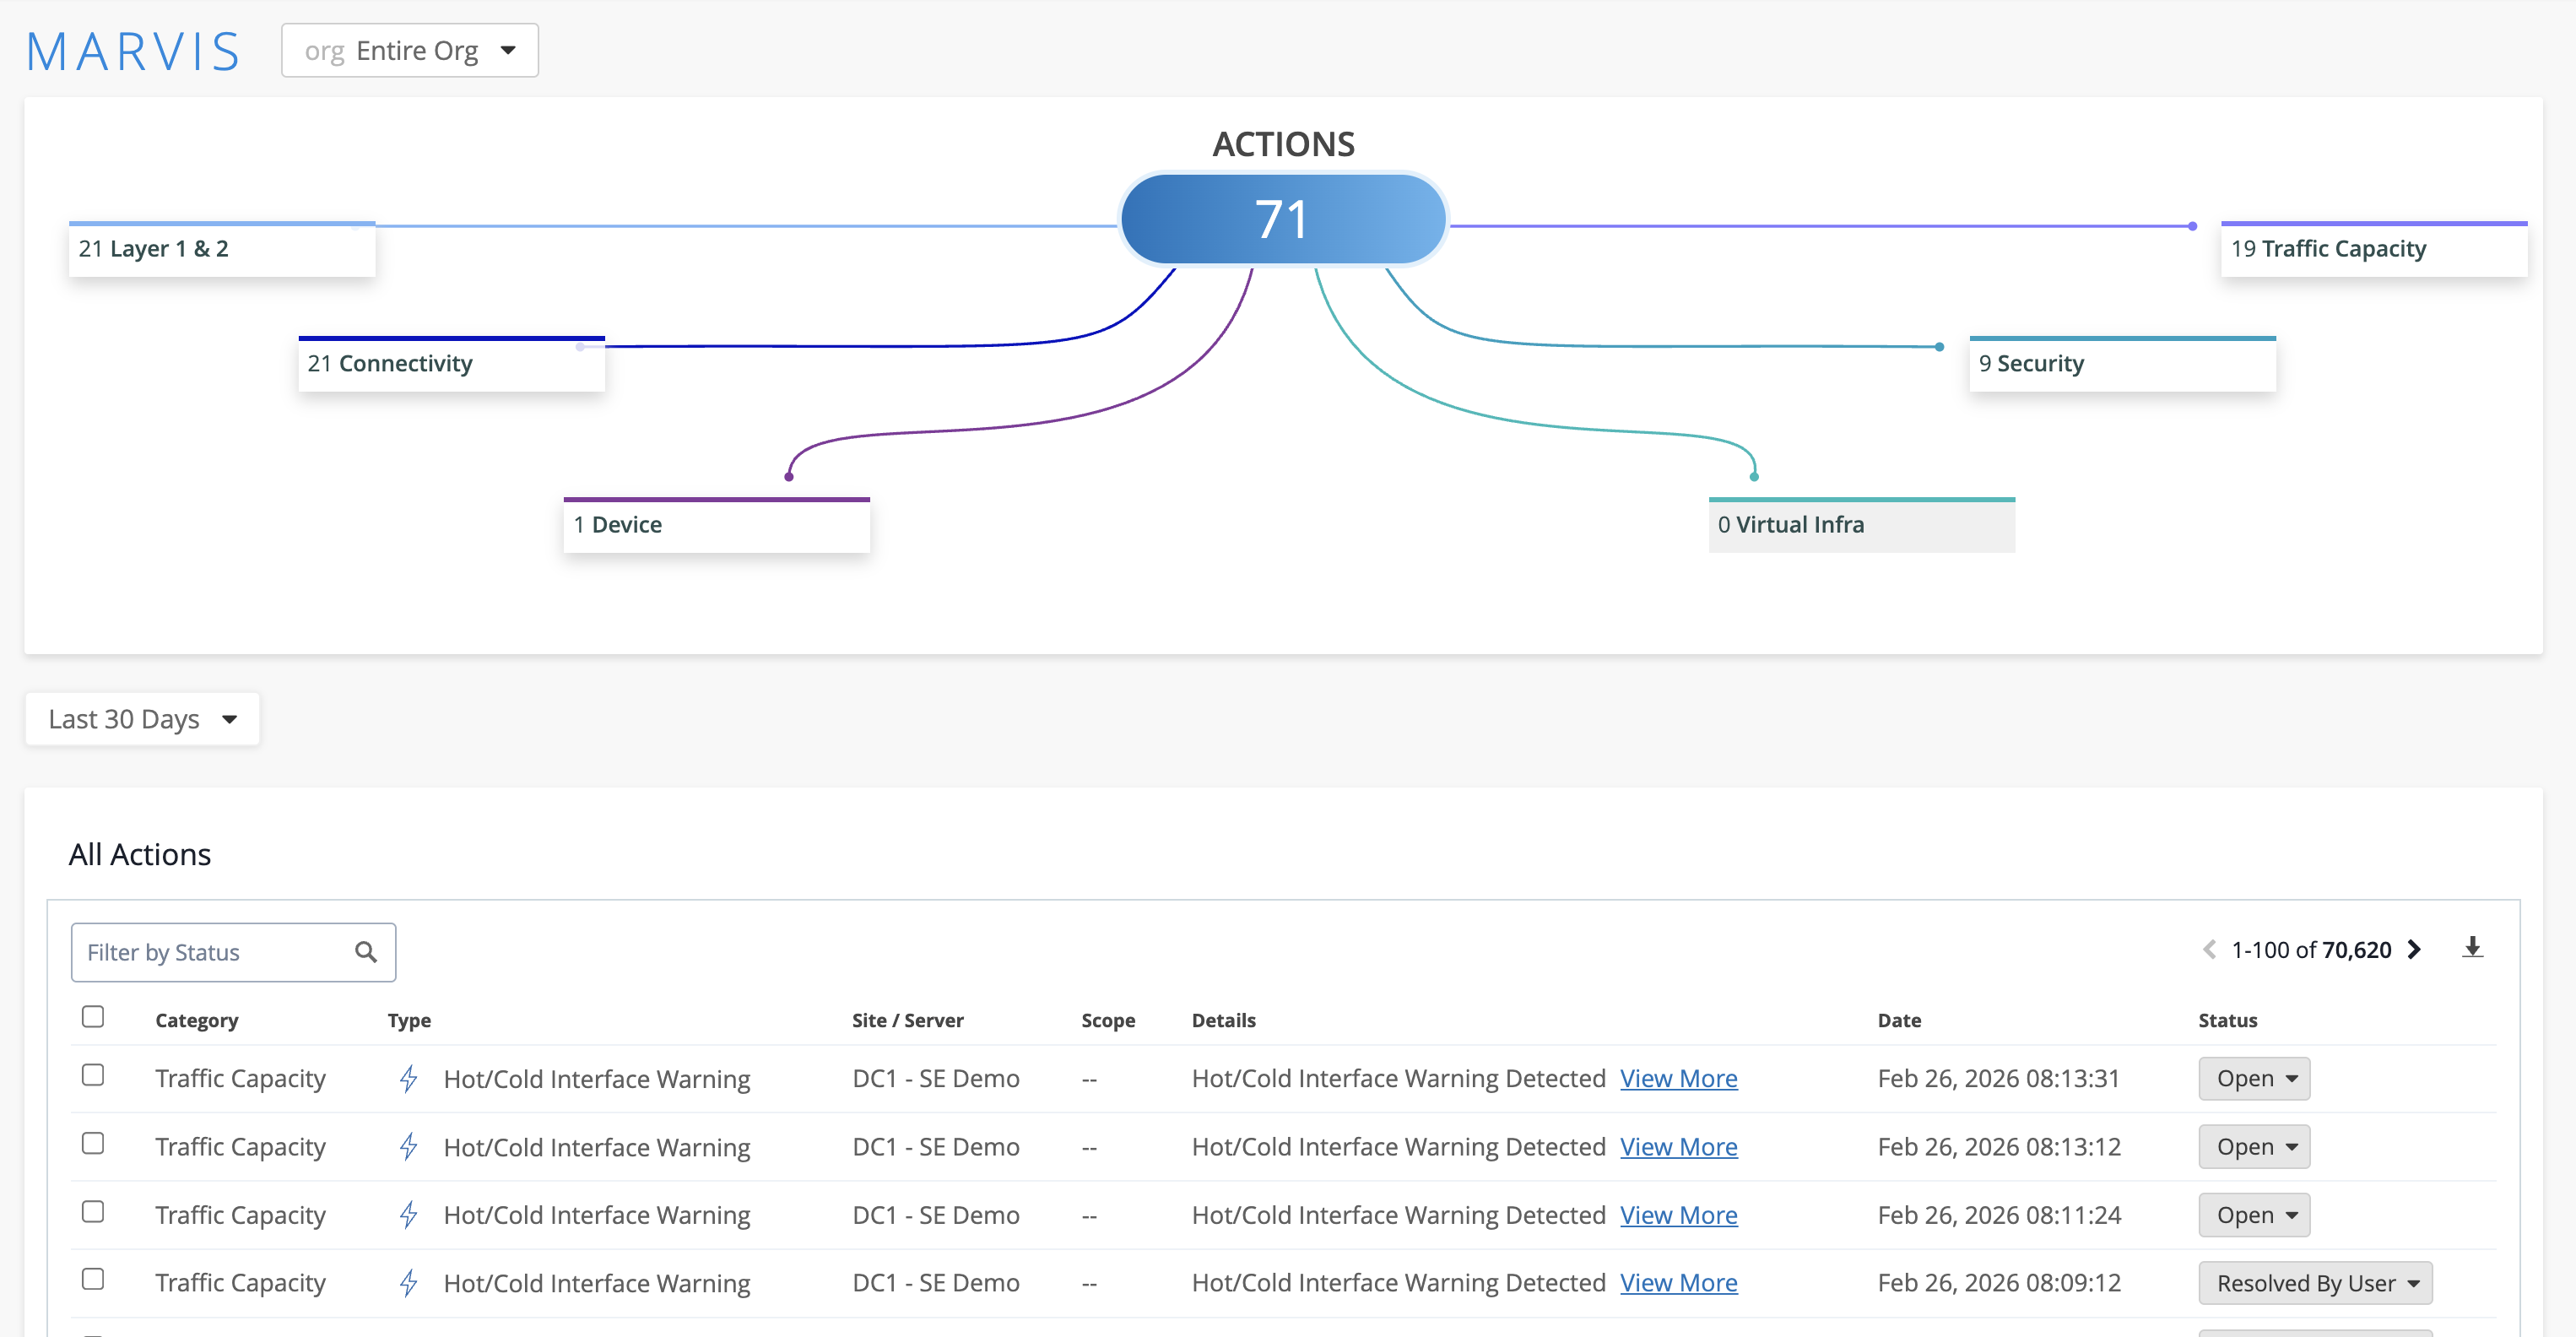
|
What is Marvis? Marvis is Juniper’s AI engine. It analyses telemetry from across all connected sites, identifies patterns, and surfaces recommended actions ranked by priority. Think of it as a first-responder that has already triaged your network before you log in — rather than landing on a dashboard full of raw alerts, you land on a prioritised list of things that actually need your attention. |
Navigating to the lab environments
-
Click DC Assurance in the top navigation menu.
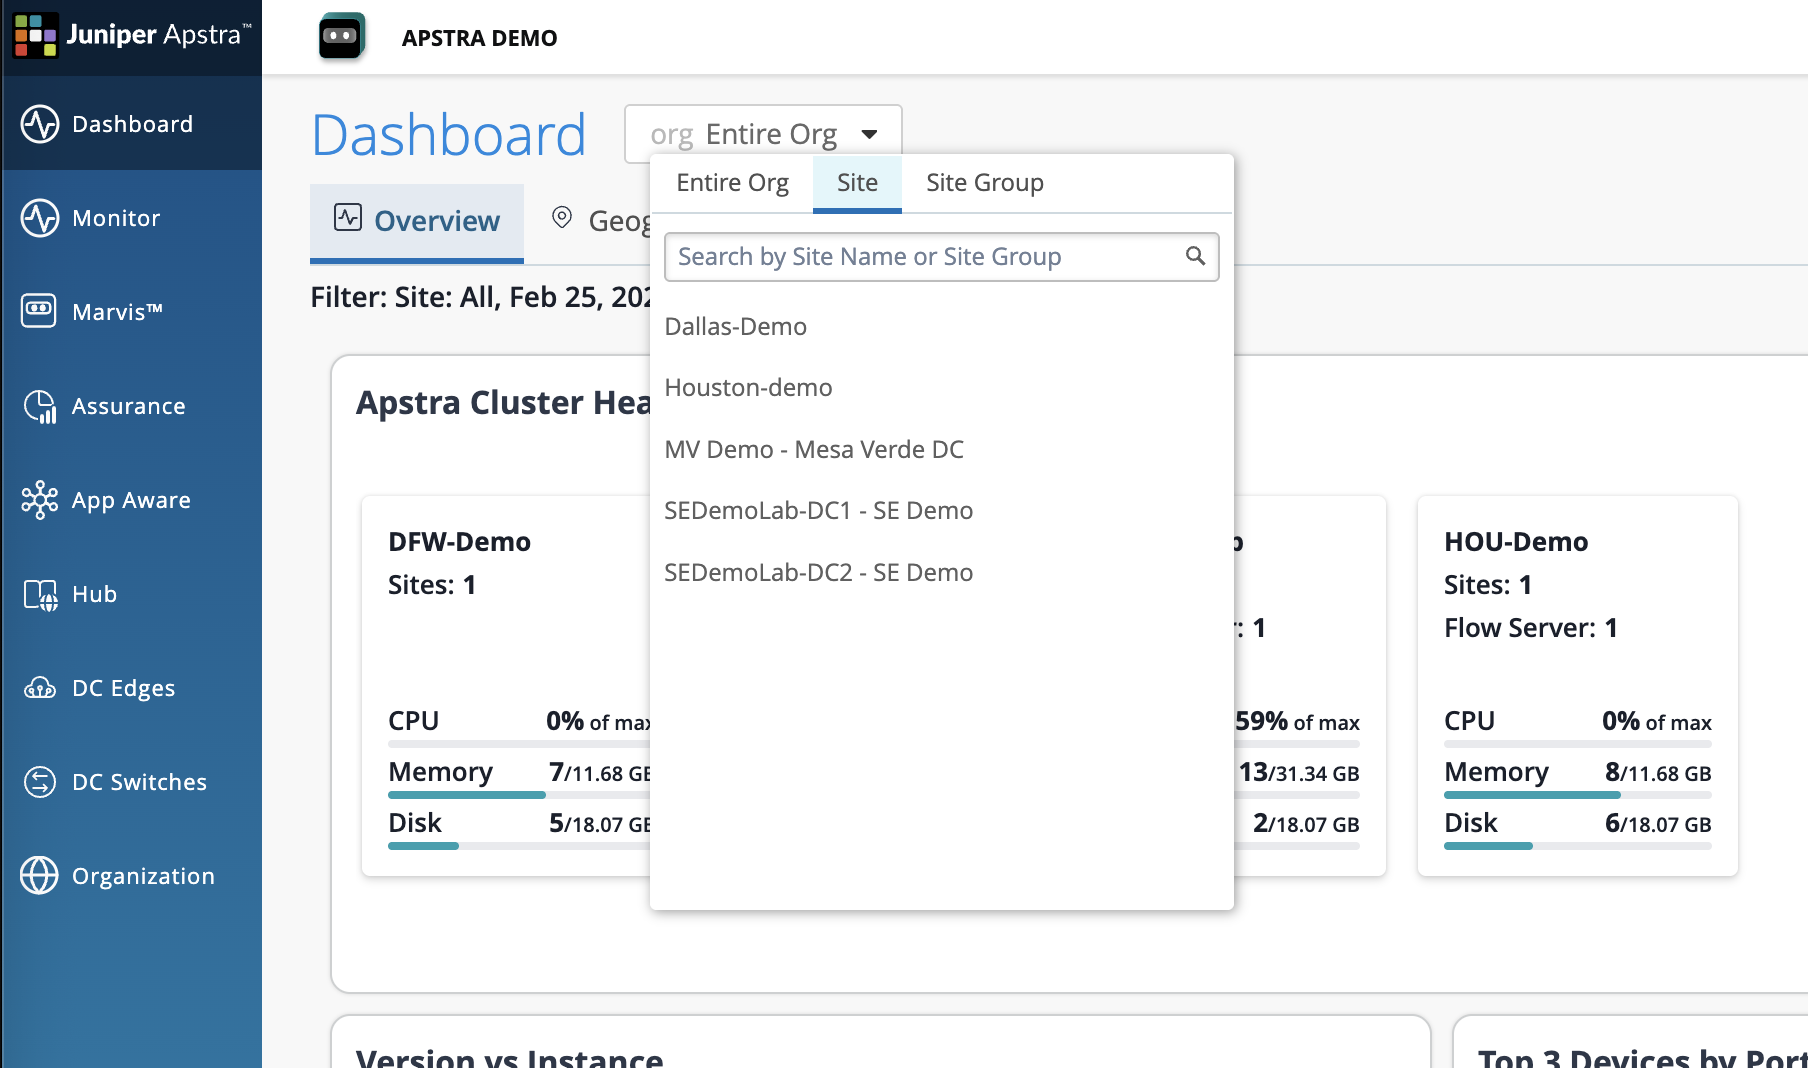
You will see SEDemoLab-DC1 and SEDemoLab-DC2. Work with DC1 for both exercises below.
|
You may notice the health scores differ between DC1 and DC2. This is intentional — the demo is configured to show a range of conditions across the two sites so you have meaningful material to explore in both. For this lab, stay with DC1. |
Two views, two different lenses
Before you begin the exercises, it is worth understanding the two views you will use — they answer different questions and work together.
| View | What it shows |
|---|---|
App Aware |
Which services and clients are actively using the network, how much traffic they are generating, and which physical paths that traffic is taking. This answers "who is affected and where is their traffic going?" |
Assurance |
What is wrong, why it is wrong, and what the root cause is. This answers "what caused the issue — and which of the alerts I am seeing are symptoms of the same underlying problem?" |
The two views are designed to work together. App Aware tells you who is affected. Assurance tells you why.
Exercise 1: Correlated visibility
In most operations environments, topology data lives in one tool and traffic data lives in another. Assembling the two takes time — time that is rarely available during an active incident.
Data Centre Assurance solves this by continuously correlating Flow data against the Apstra fabric model. The combined view is always available, before anyone thinks to ask for it.
-
Navigate to App Aware and confirm SEDemoLab-DC1 – SE Demo is selected.
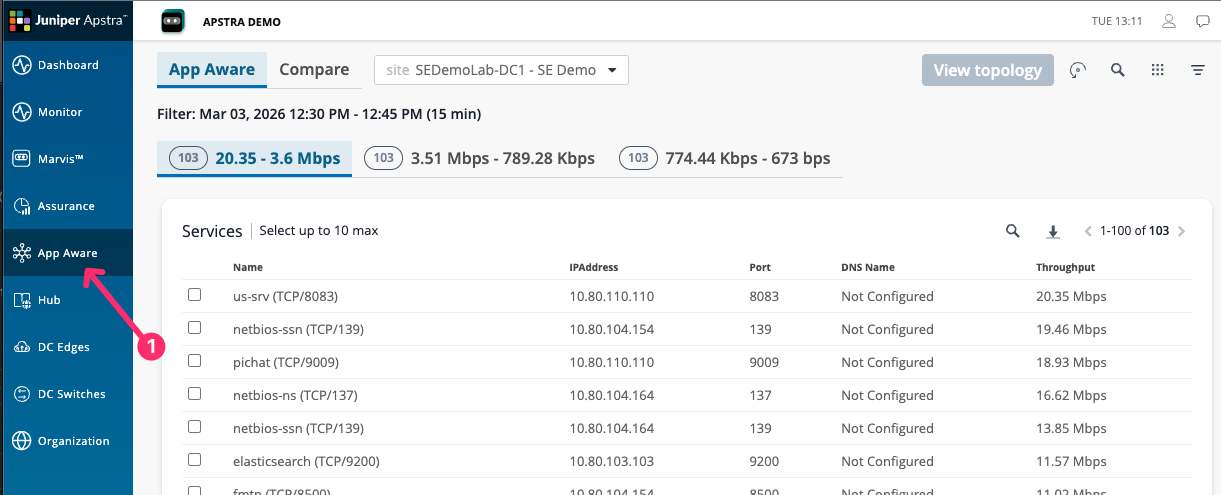
-
Select one or more services from the list and click View Topology.
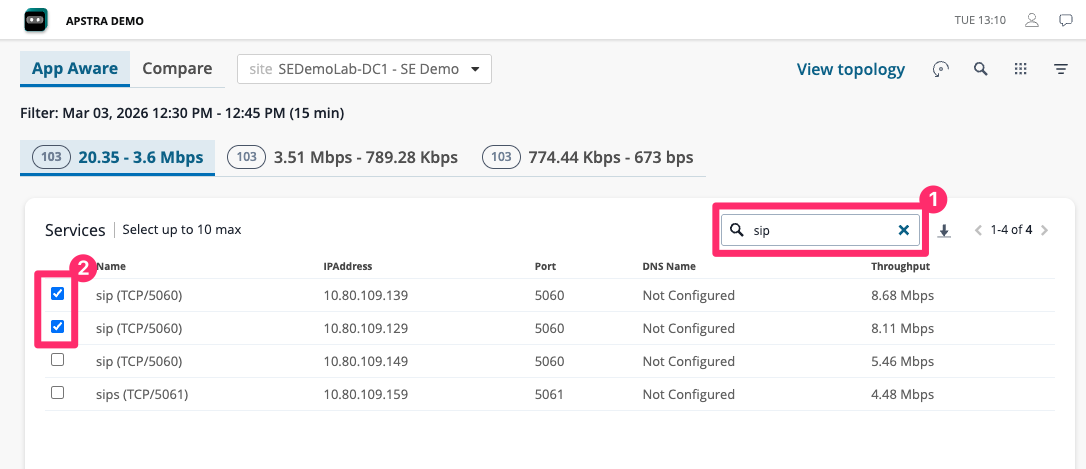
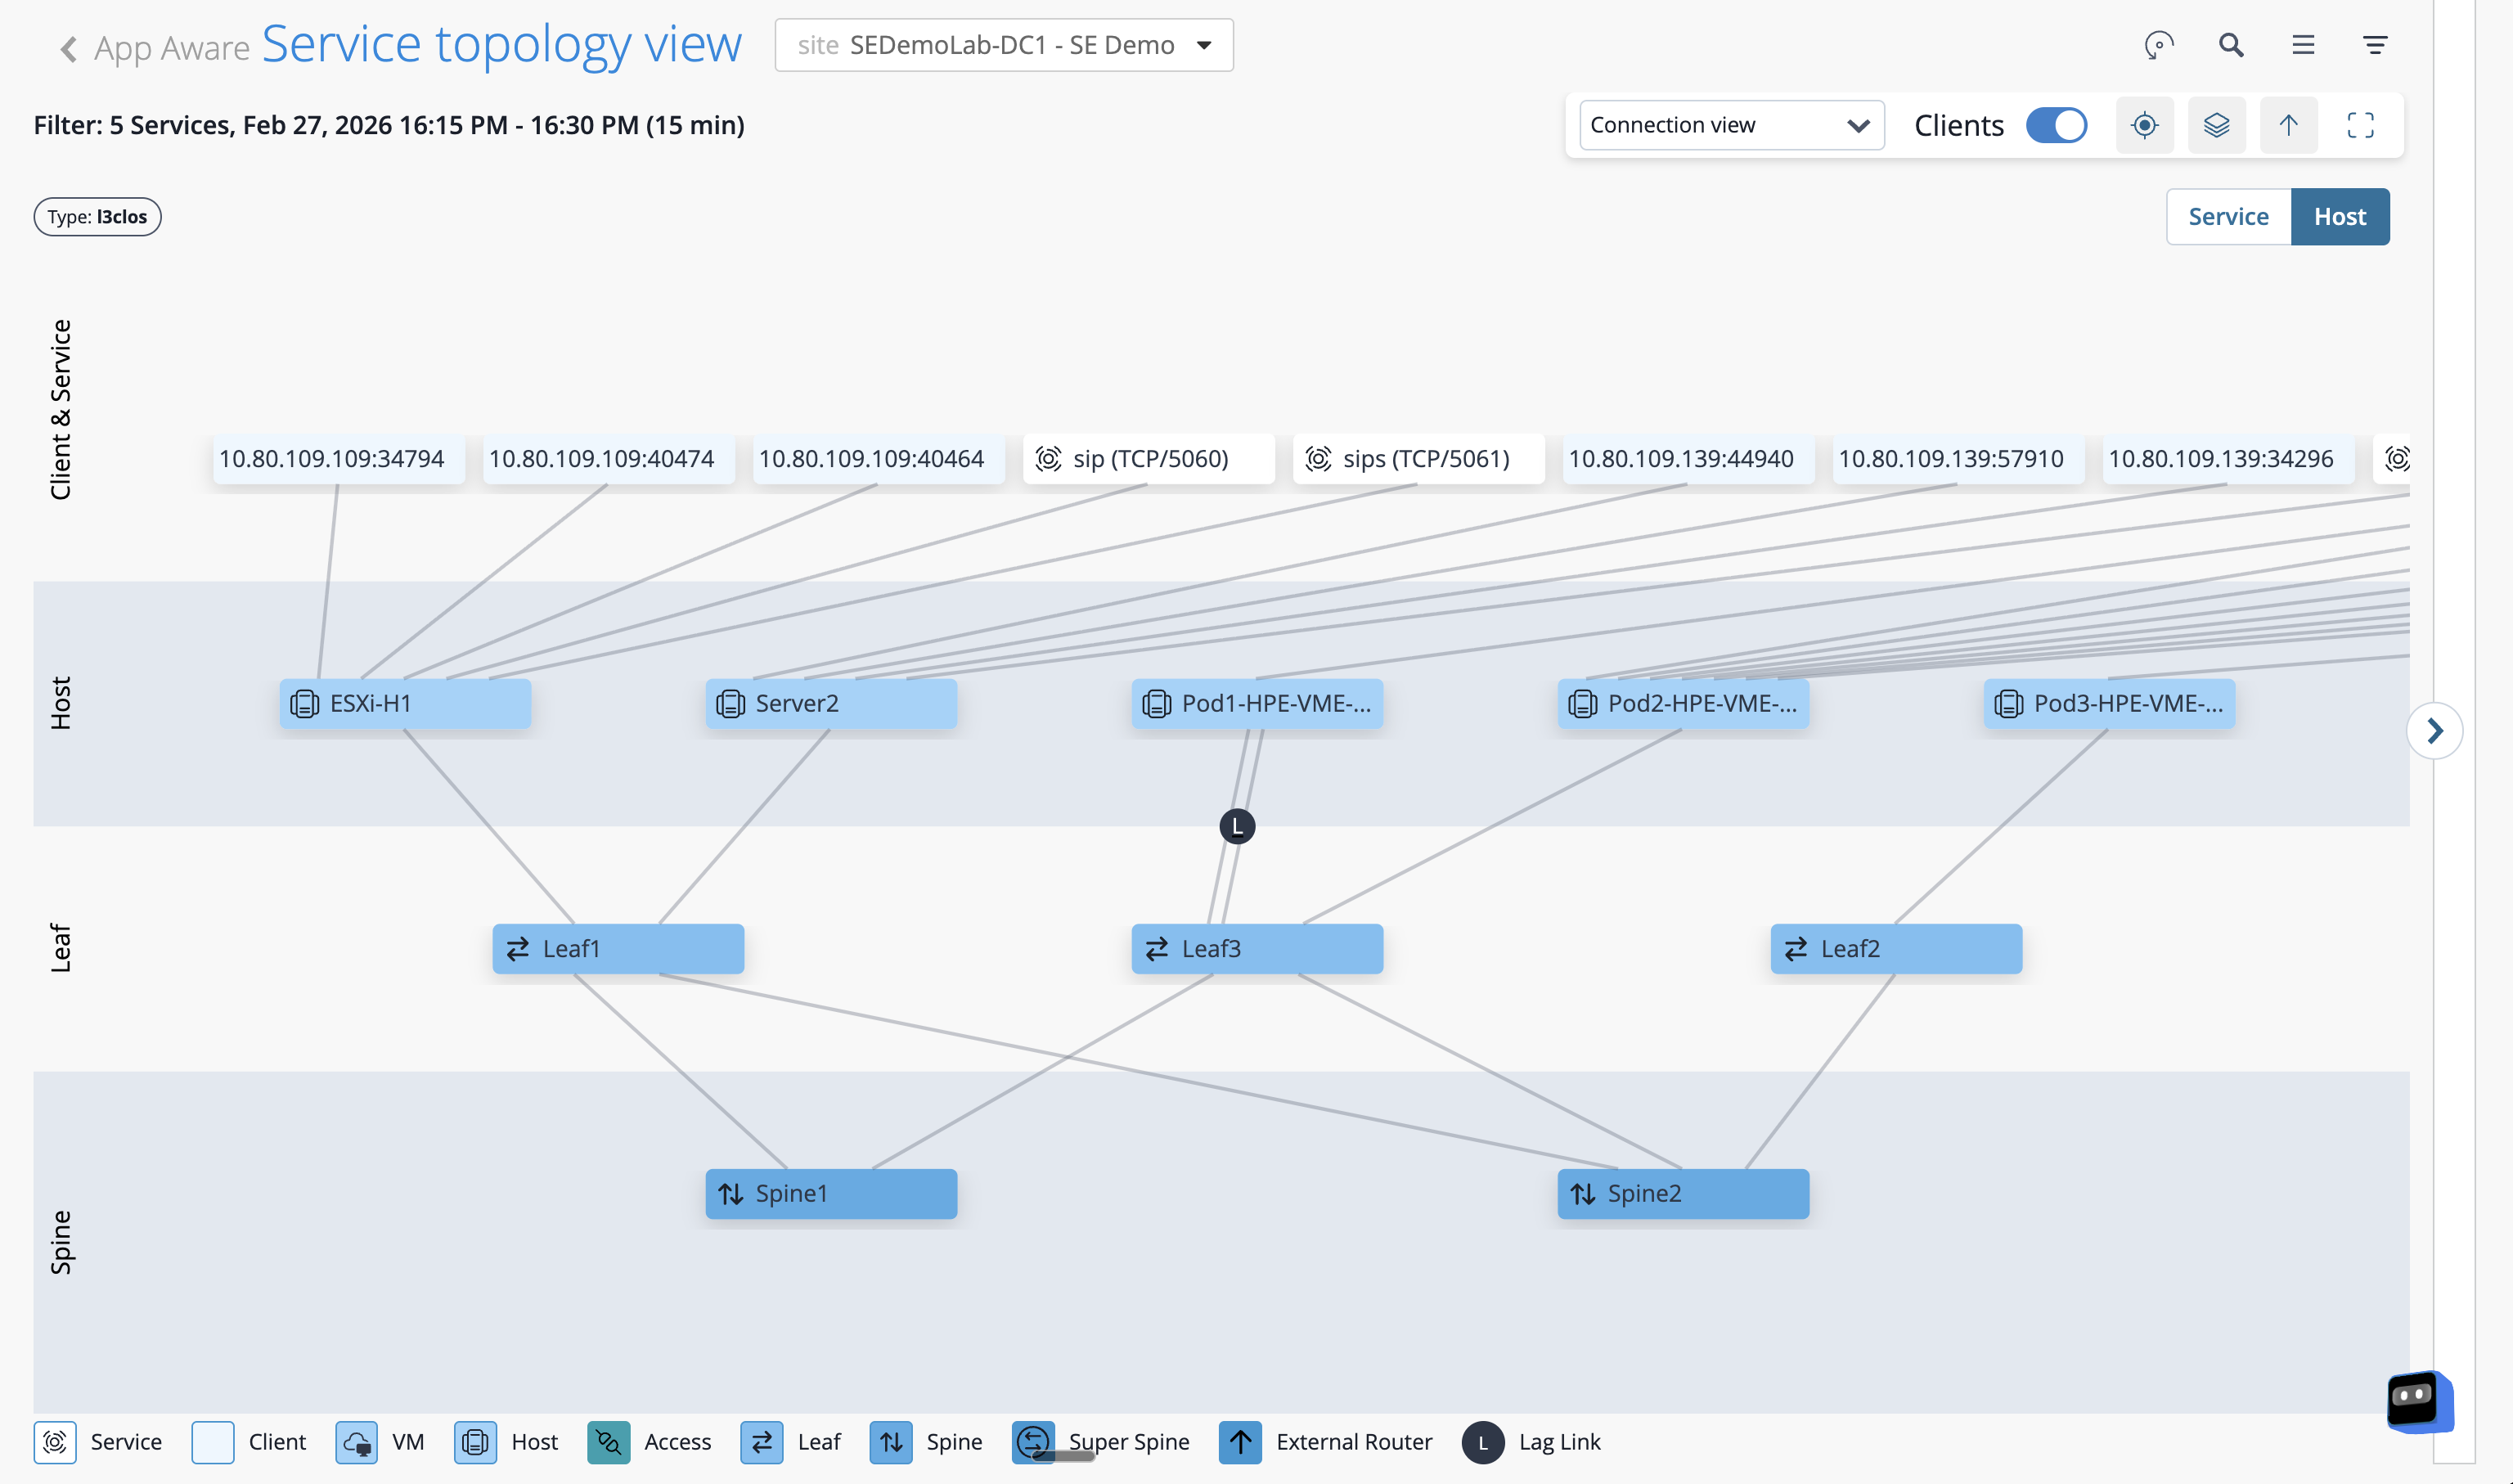
The topology renders showing only the devices and links that the selected service is actively using — everything irrelevant is filtered out.
-
Click on any active flow in the list or on the topology overlay.
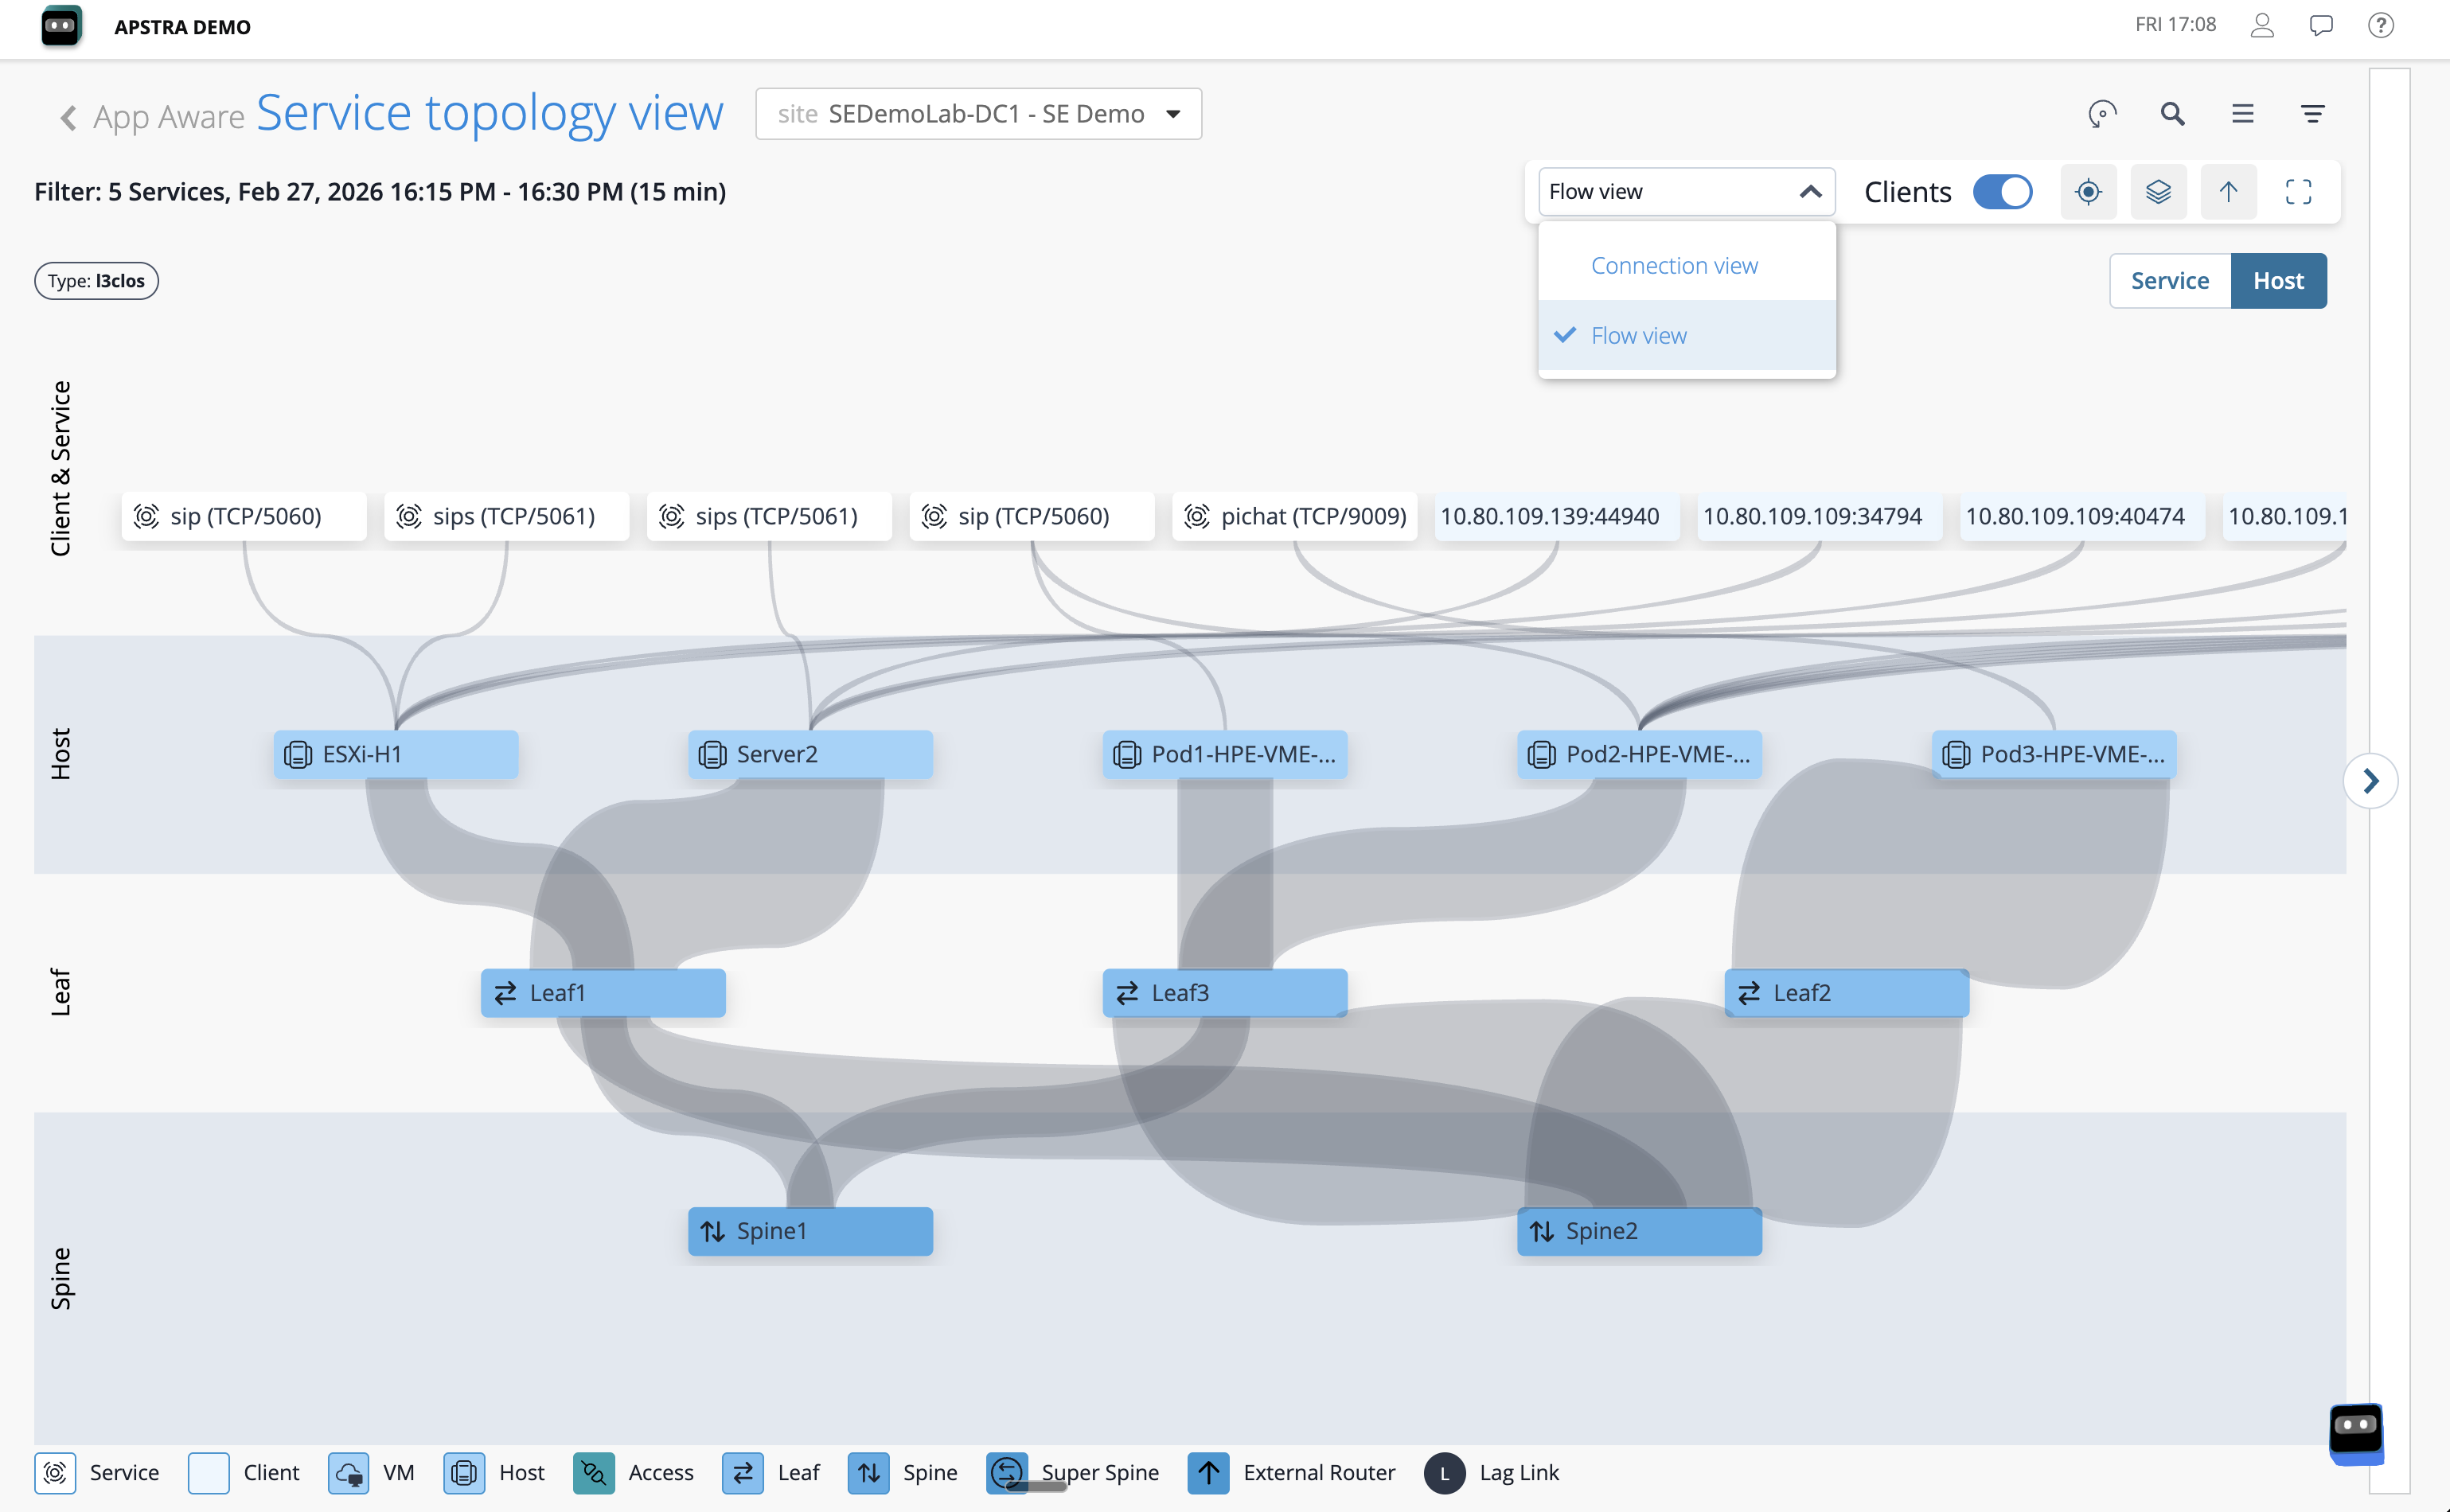
The detail panel shows the source and destination addresses, the protocol, the traffic volume, and the exact path the flow took through the fabric — device names, interface identifiers, and link utilisation included.
|
Those device names and interface identifiers are not looked up from a CMDB or a configuration management table. Data Centre Assurance already knows them because the Apstra fabric model contains the complete relationship between every IP address, every interface, and every device. The context is structural — always current, always accurate, with no manual reconciliation required. |
Exercise 2: Root cause analysis
Alert fatigue is one of the most persistent problems in network operations. A single link failure can trigger dozens of alerts — one from every device, flow, and application that depends on that link. An engineer receiving those alerts has to work backwards through all of them to find the common cause. By the time they do, significant time has passed.
Data Centre Assurance works forwards from the fabric model. It understands which alerts are symptoms of the same underlying issue and surfaces the root cause directly — so you start your investigation at the answer, not the noise.
-
Navigate to Assurance and confirm SEDemoLab-DC1 – SE Demo is selected.
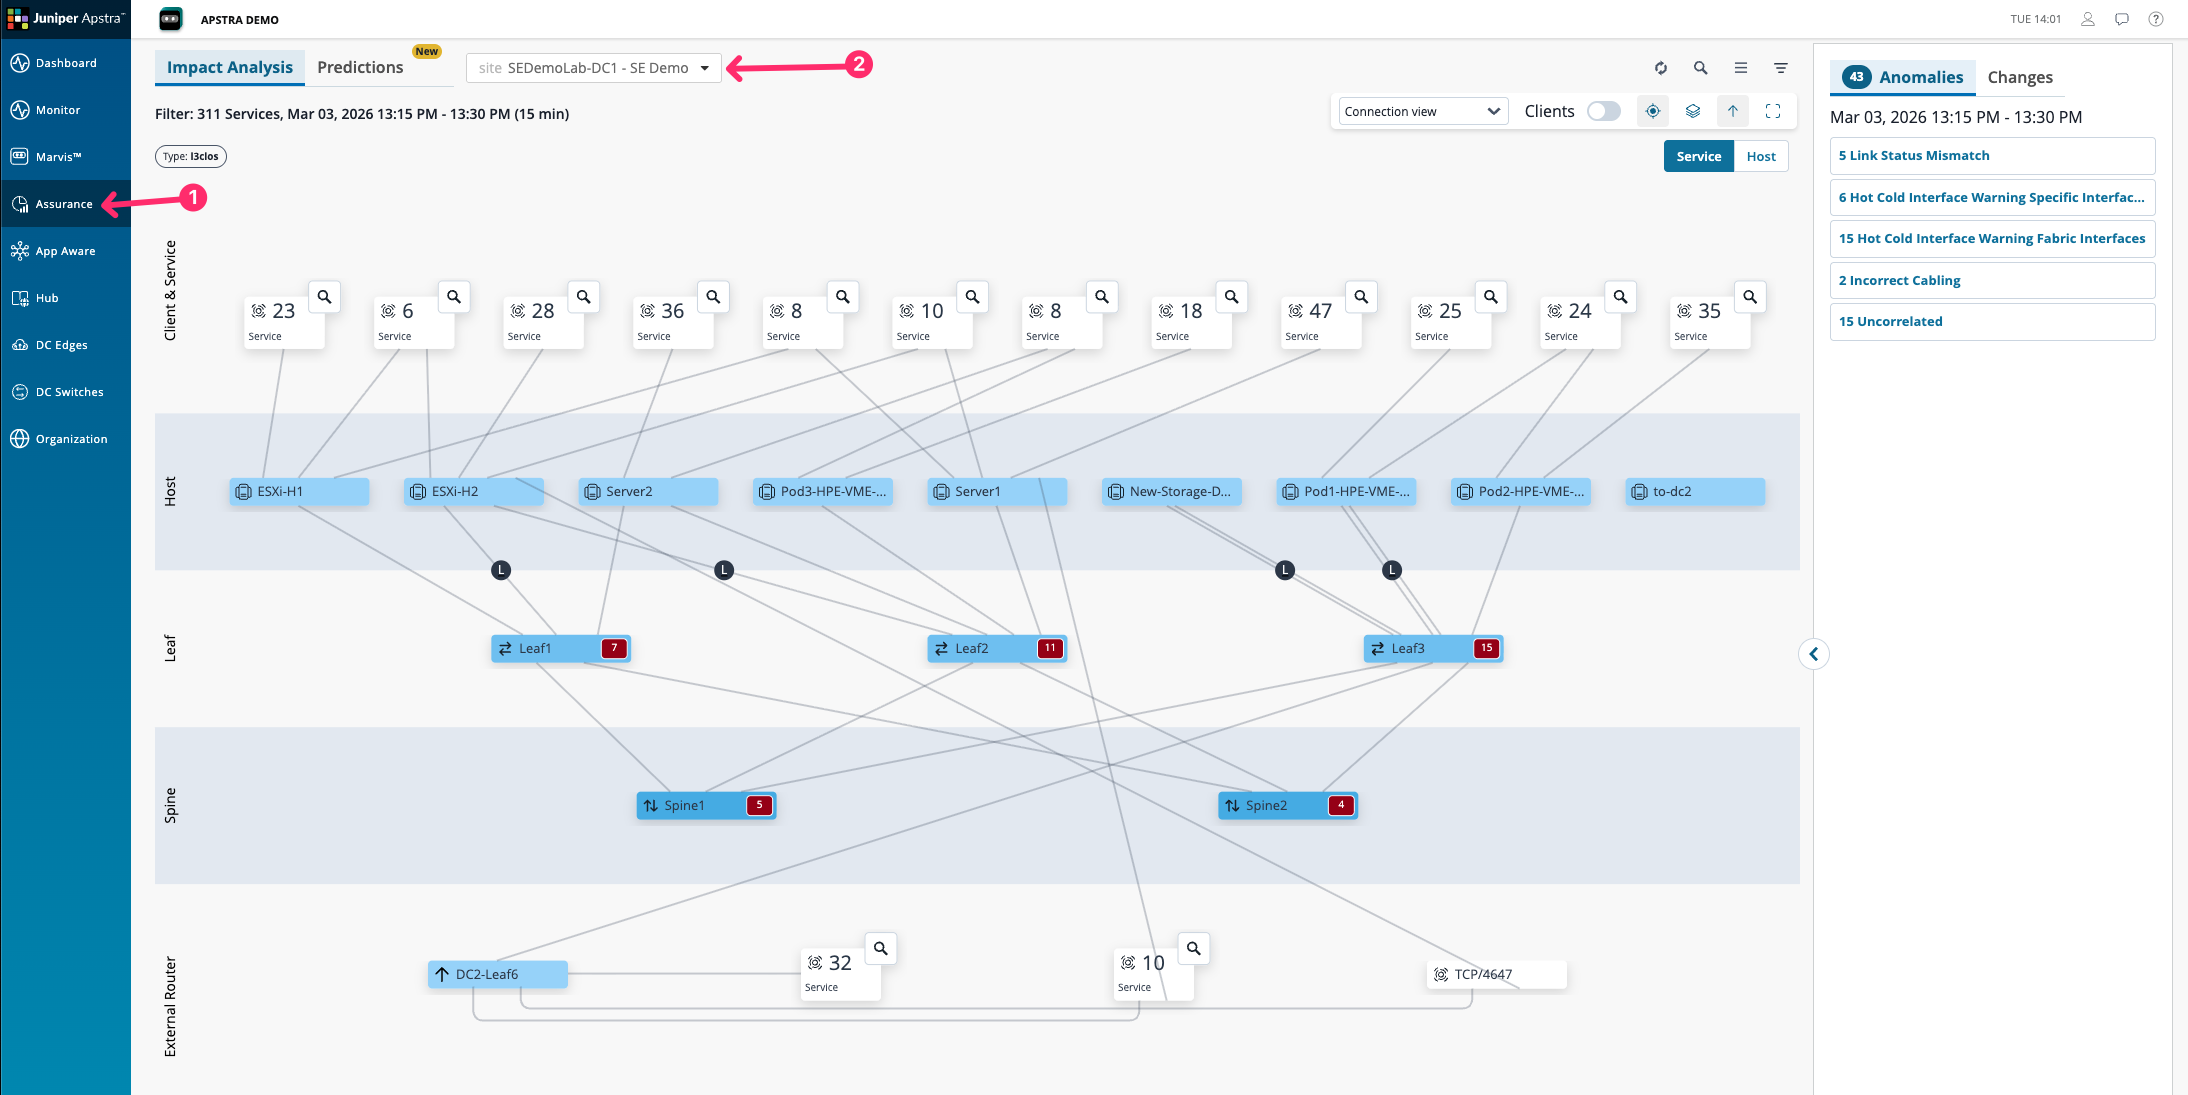
The topology view shows all affected services and clients in the fabric at this moment. On the right-hand side, issues are sorted by root cause — not by alert volume.
-
Click on the Incorrect Cabling issue.
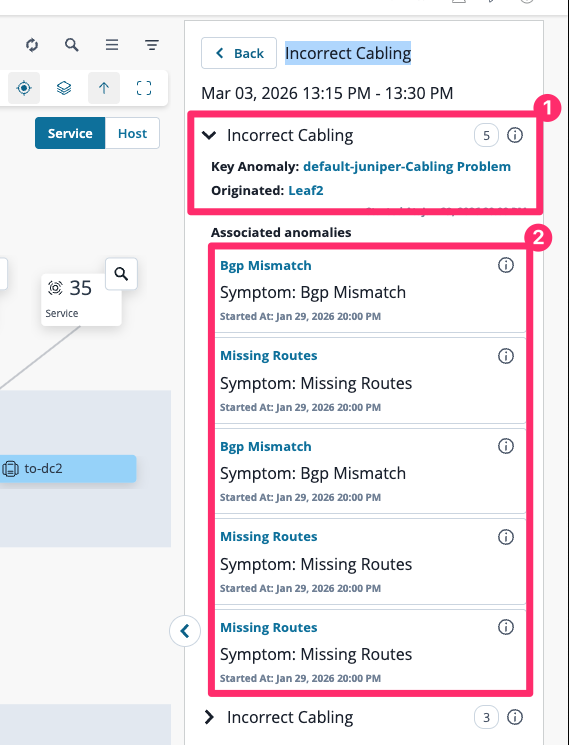
The root cause sits at the top. Every associated symptom sits below it — flagged clearly as downstream effects of the same underlying problem.
|
Think about the investigation process this view replaces. In a typical operations environment, a team might spend 30 minutes or more pulling logs, cross-referencing device state, and reconstructing which services were affected by a single physical issue. Data Centre Assurance has already assembled that picture — before anyone raises a ticket. You do not want to spend time troubleshooting missing routes and BGP session failures if the root cause is an incorrectly cabled cable. Knowing the root cause first means your team acts on the right problem immediately. |
What you have just seen
The two exercises in this section illustrate different sides of the same capability. App Aware shows you who is using the network and how. Assurance shows you what is wrong and why. Together, they represent the shift from assembling a picture of your network to simply having one — continuously, across every site Apstra manages.
That is the end of the lab content. Move to the final milestone checkpoint.