Demo 3 - Root cause analysis
This is the final scenario, building on the SLE health view and the correlated visibility you have already explored. Rather than presenting a long list of alerts, DC Assurance correlates events against the fabric topology to identify where a problem is actually coming from. The distinction matters enormously in a network operations context.
What to consider before you explore
When you get an alert today, how long does it typically take your team to work out whether it is the root cause of a problem — or just one of many symptoms? In most operations environments, the answer involves pulling data from multiple tools and reasoning backwards through the alert chain.
Alert fatigue is one of the most persistent frustrations in network operations. Monitoring tools generate large volumes of events, and the people responsible for responding to them spend a significant portion of their working day deciding which ones are real. By the time a genuine issue has been confirmed and traced to a root cause, valuable time has been lost.
DC Assurance approaches this differently. Instead of alerting on every metric that crosses a threshold, it uses the fabric model to understand which events are related, which are likely to be symptoms of the same underlying cause, and where in the topology the root cause probably sits. The result is fewer, higher-quality alerts — each with context already attached.
Opening the anomaly view
Navigate to Assurance > SEDemoLab-DC1 – SE Demo. Look at the issues panel on the right side of the screen.
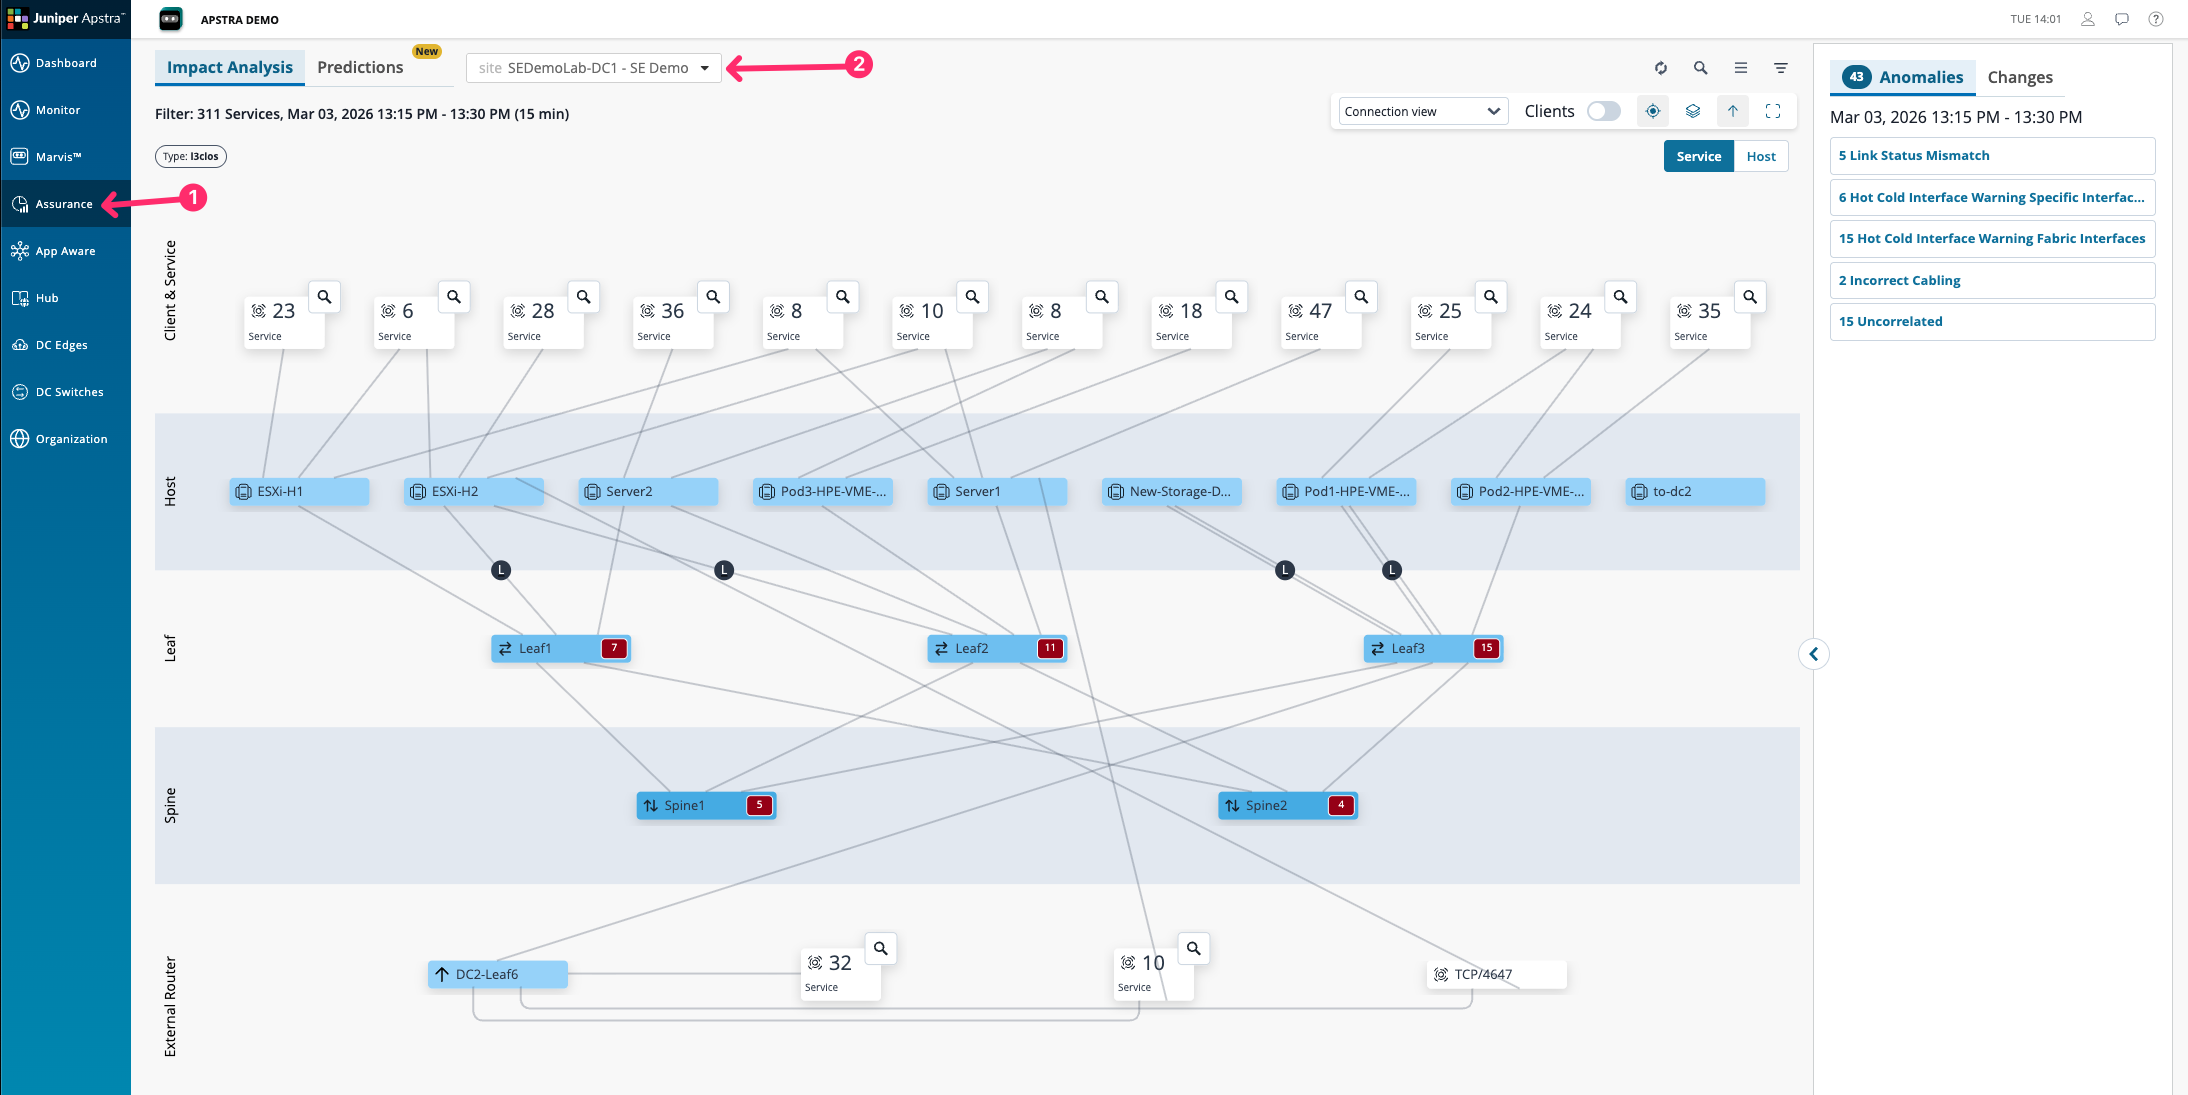
The topology view here shows all of the affected services and clients in the data centre at this current moment. The services may be affected by one or a number of different issues present within the fabric.
You will see a list of issues sorted by root cause on the right hand side. These are not raw metric alerts — they are anomalies that DC Assurance has detected, classified, and correlated against the fabric topology.
Click on the Incorrect Cabling issue in the list to open its detail view.
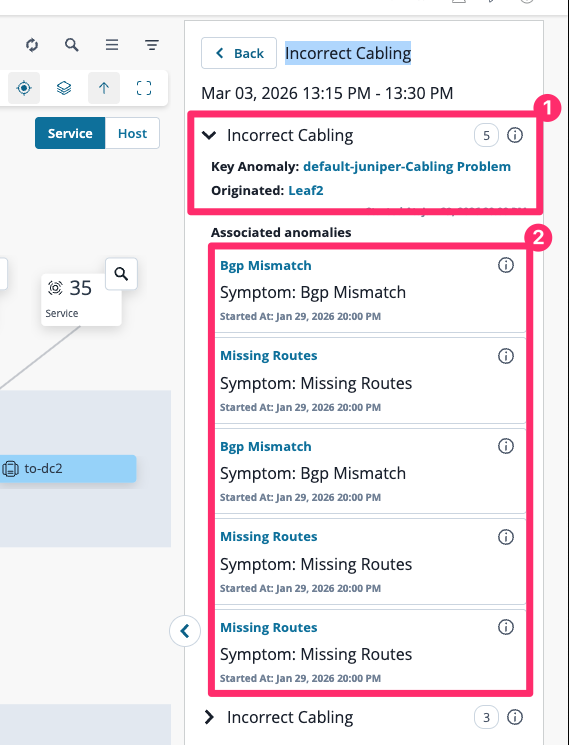
We can now see the root cause, which is highlighted as the key anomaly, and below that all of the associated symptoms, which in our case is just noise. You do not want to be troubleshooting missing routes and BGP mismatches if physical cabling is incorrect.
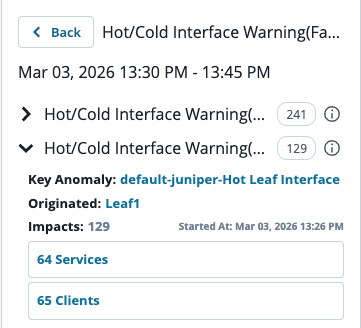
Reading the anomaly detail
The anomaly detail view shows several things that a standard alert does not, what users are affected om your network.
The value is not just that DC Assurance found the anomaly — a threshold-based tool could do that. The value is that it found the root cause rather than all the symptoms. In a typical monitoring environment, a single link failure can generate dozens of alerts: every device using that link raises its own alert, every flow passing through it shows as degraded, every application depending on it reports a performance issue. A network engineer receiving those alerts has to work backwards through all of them to find the common cause. DC Assurance works forward from the fabric model.
Think about what this removes from the investigation process. In most operations environments, the team that monitors the network is different from the team that makes changes to it. The monitoring team identifies a problem and raises a ticket. The change management team receives it and has to reconstruct the context before acting. DC Assurance,