Section 2: Architecture overview
Before exploring the demo scenarios, it helps to have a clear mental model of how the components relate to each other. Without this context, the product can look like a dashboard that shows metrics. With it, it looks like a coherent system that genuinely understands your network.
The three components and how they relate
There are three components in play throughout this lab. Here is how they fit together.
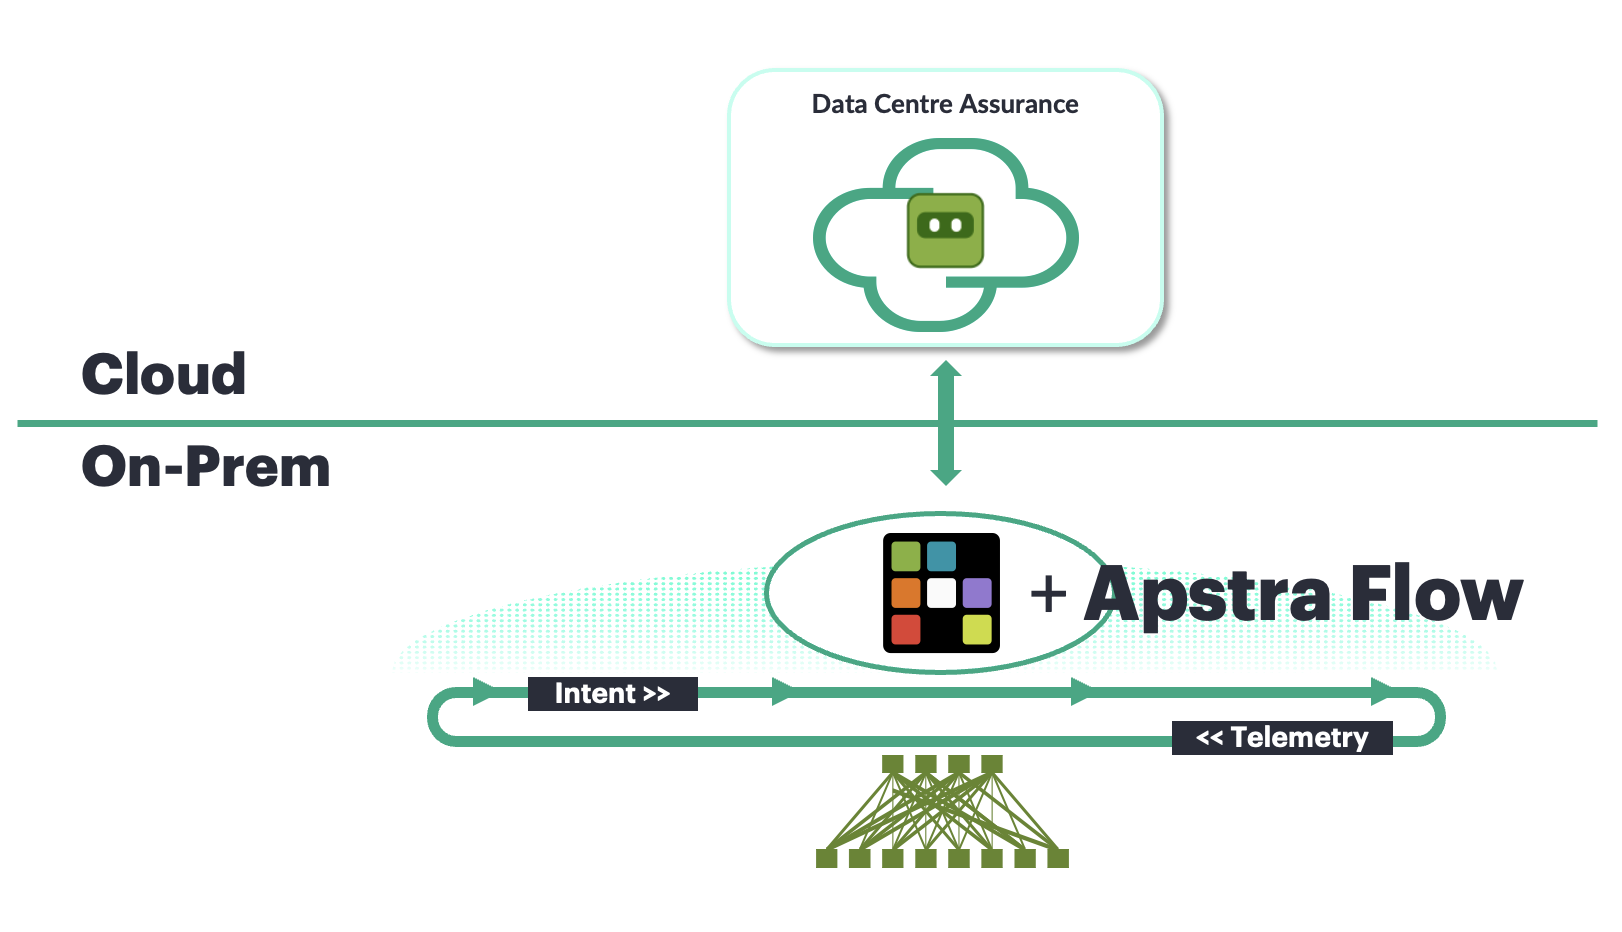
Apstra Data Center Director sits at the base. It manages the network fabric and maintains a structured, relational model — think of it as a database that understands not just what devices exist, but how they connect, what they are supposed to be doing, and how every configuration element relates to every other. This is not a simple inventory list. It is a living model of the network’s intended state.
DC Assurance connects to Apstra Data Center Director and takes that structural knowledge further. It pulls in Flow data — the record of actual traffic moving through the fabric — and correlates it against Apstra’s model. The result is a view where every traffic flow carries context: which device it passed through, which interface, which virtual network, what the link was supposed to be doing at the time.
HPE Mist provides the cloud infrastructure that DC Assurance runs on. It handles data ingestion at scale, runs the machine learning pipelines, and delivers the dashboards and alerts you see in the interface. This is the same platform that has been running HPE Mist’s wireless and wired assurance products for over ten years, across thousands of enterprise deployments.
Why this architecture produces better insights
The core insight is about data quality. Most monitoring tools work with a flat stream of metrics — a device sends CPU utilisation, an interface sends packet counts, and the tool watches for values that cross a threshold. This works, but it has no structural awareness. It cannot tell you that the device reporting high CPU is a spine switch, that it connects to these specific leaf switches, or that the traffic it is processing is part of a specific virtual network serving a specific set of workloads.
Apstra Data Center Director’s graph database contains all of that structural information. When DC Assurance correlates a Flow record against the fabric model, it can attach context that would take a human engineer minutes or hours to piece together manually.
Think about what that investigation process looks like today. When an alert arrives, how long does it take your team to understand what it actually means and decide what to do? You will see this play out across the three demo scenarios.
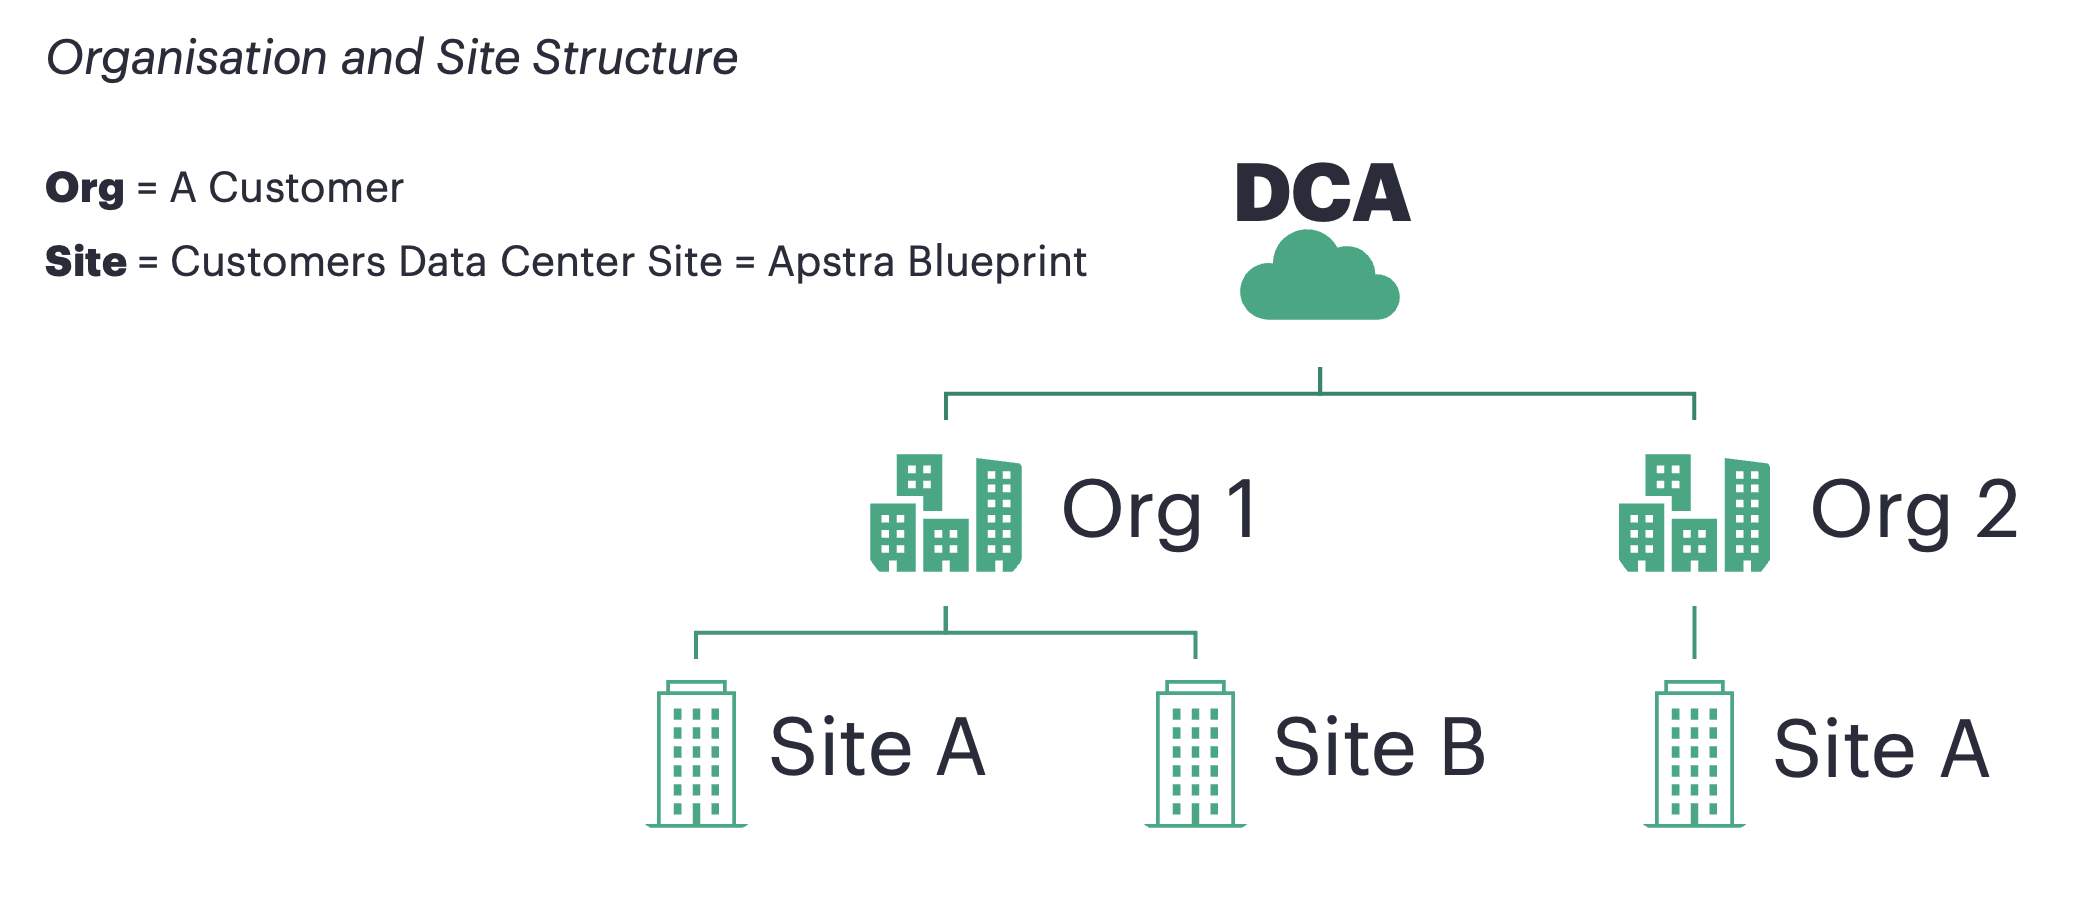
How blueprints map to sites
In Apstra Data Center Director, each blueprint represents a unique data centre — a distinct physical or logical data centre fabric with its own devices, links, and policies. DC Assurance connects to one or more Apstra Data Center Director instances, and each instance can contain multiple blueprints.
The multi-site dashboard
Navigate back to the main DC Assurance dashboard by clicking Dashboard in the left-hand navigation.
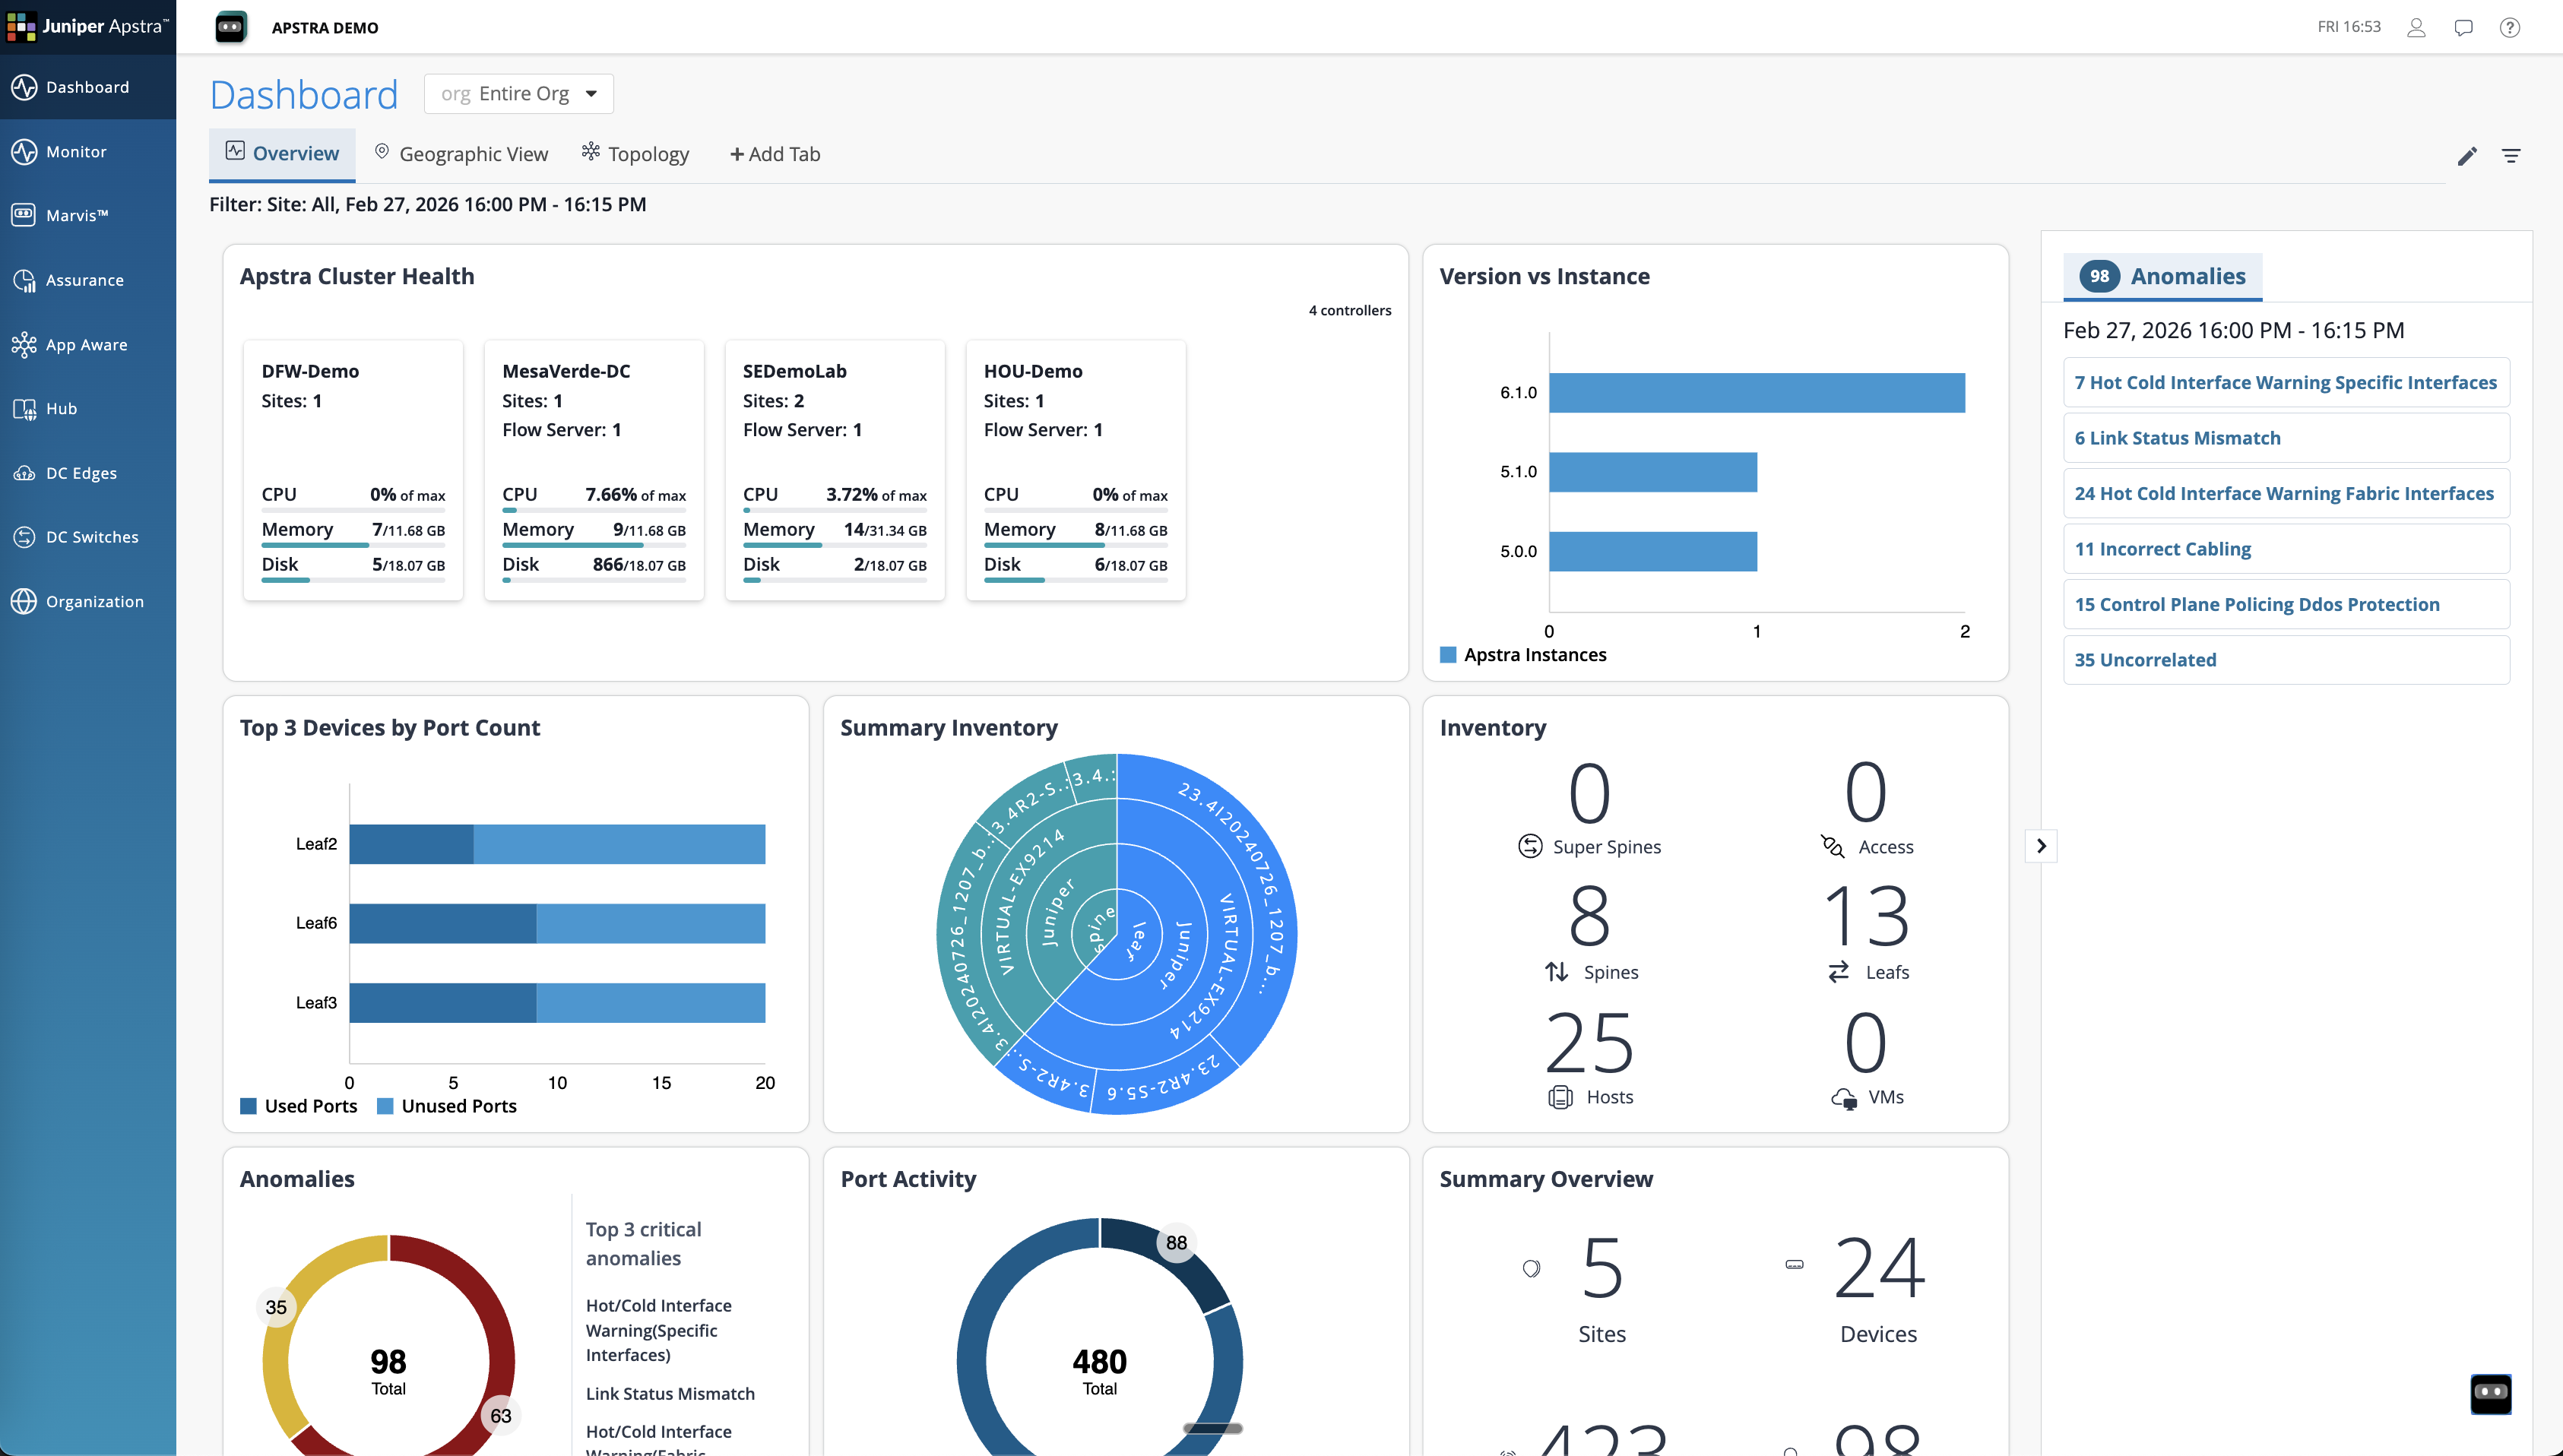
This is a single view showing health of every Apstra Data Centre Director instance connected to DC Assurance. If your organisation manages multiple data centres, consider what it currently takes to get this kind of overview — how many tools, how many logins, and how much manual effort to compare conditions across locations. This view gives you all of that in one place, updated in real time.