Section 1: Exploring a live environment
You have a fully deployed data centre which has already been created for you. Your goal in this lab is to understand what’s been deployed and make real changes to it. All done via Apstra.
|
In this lab, we don’t have any attached devices, but Apstra can model the entire network without any physical or virtual kit. This allows us to explore the full Apstra experience without needing to worry about hardware or connectivity. The concepts and workflows are the same as if you had real devices attached. |
Before you start: two things worth understanding
What is a blueprint?
A blueprint is the heart of everything in Apstra. It is a live, continuously validated model of your entire data centre — the design intent, the deployed configuration, and a constant comparison between the two. Everything you do in this lab happens inside a blueprint.
When Apstra detects that your live network does not match the blueprint, it raises an anomaly. When you make a change in the blueprint and commit it, Apstra pushes that change to every affected device simultaneously.
How Apstra manages changes: Staged vs Active
Before you navigate anywhere, this concept is worth understanding because you will see it everywhere.
Apstra separates what you want from what is running:
| View | What it shows |
|---|---|
Staged |
Your design workspace. Make changes here — add racks, create networks, connect servers. Nothing touches the live network until you commit. |
Active |
What is actually running right now. The live network, continuously validated against the blueprint. |
Uncommitted |
The difference between what you have staged and what is currently active. This is your review step before anything goes live. |
When you click Commit, Apstra calculates exactly what needs to change on every device, generates the configuration, and pushes it — all in one operation. You will do this several times during the lab, and each commit creates a permanent, reversible snapshot of the network state.
Navigating to your blueprint
-
From the Apstra main menu, navigate to Blueprints.
-
Find your assigned lab blueprint.
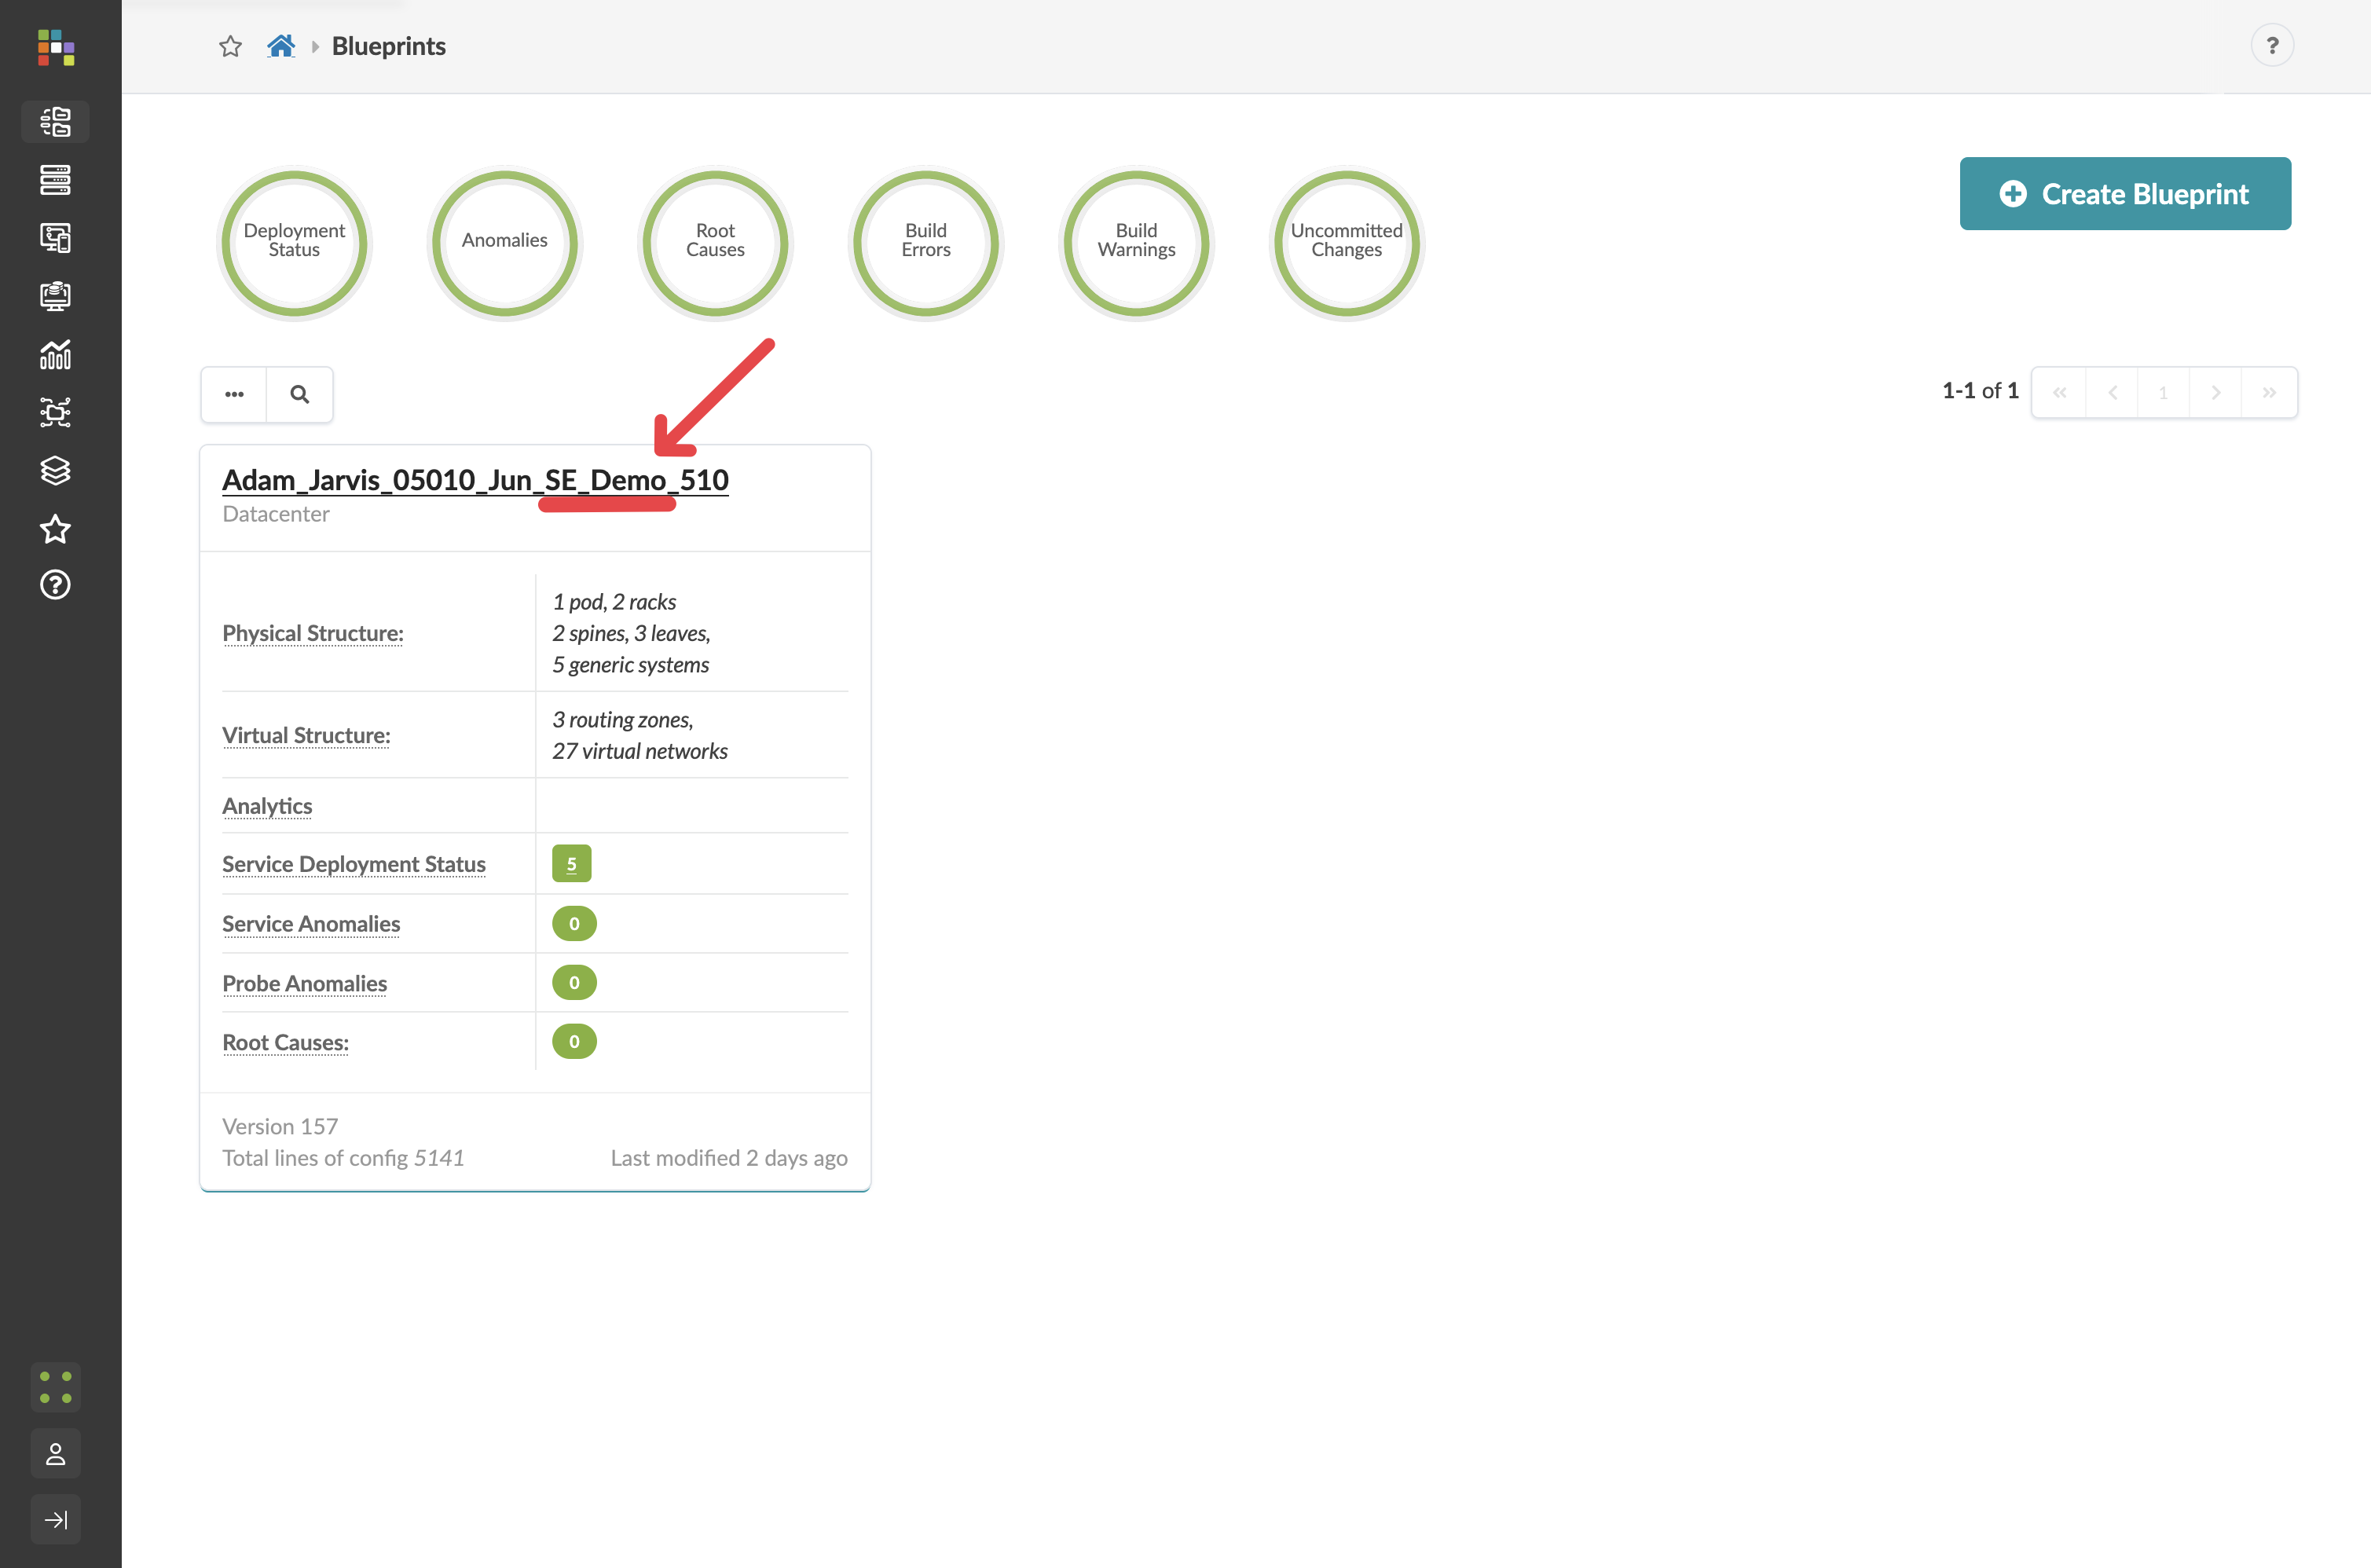
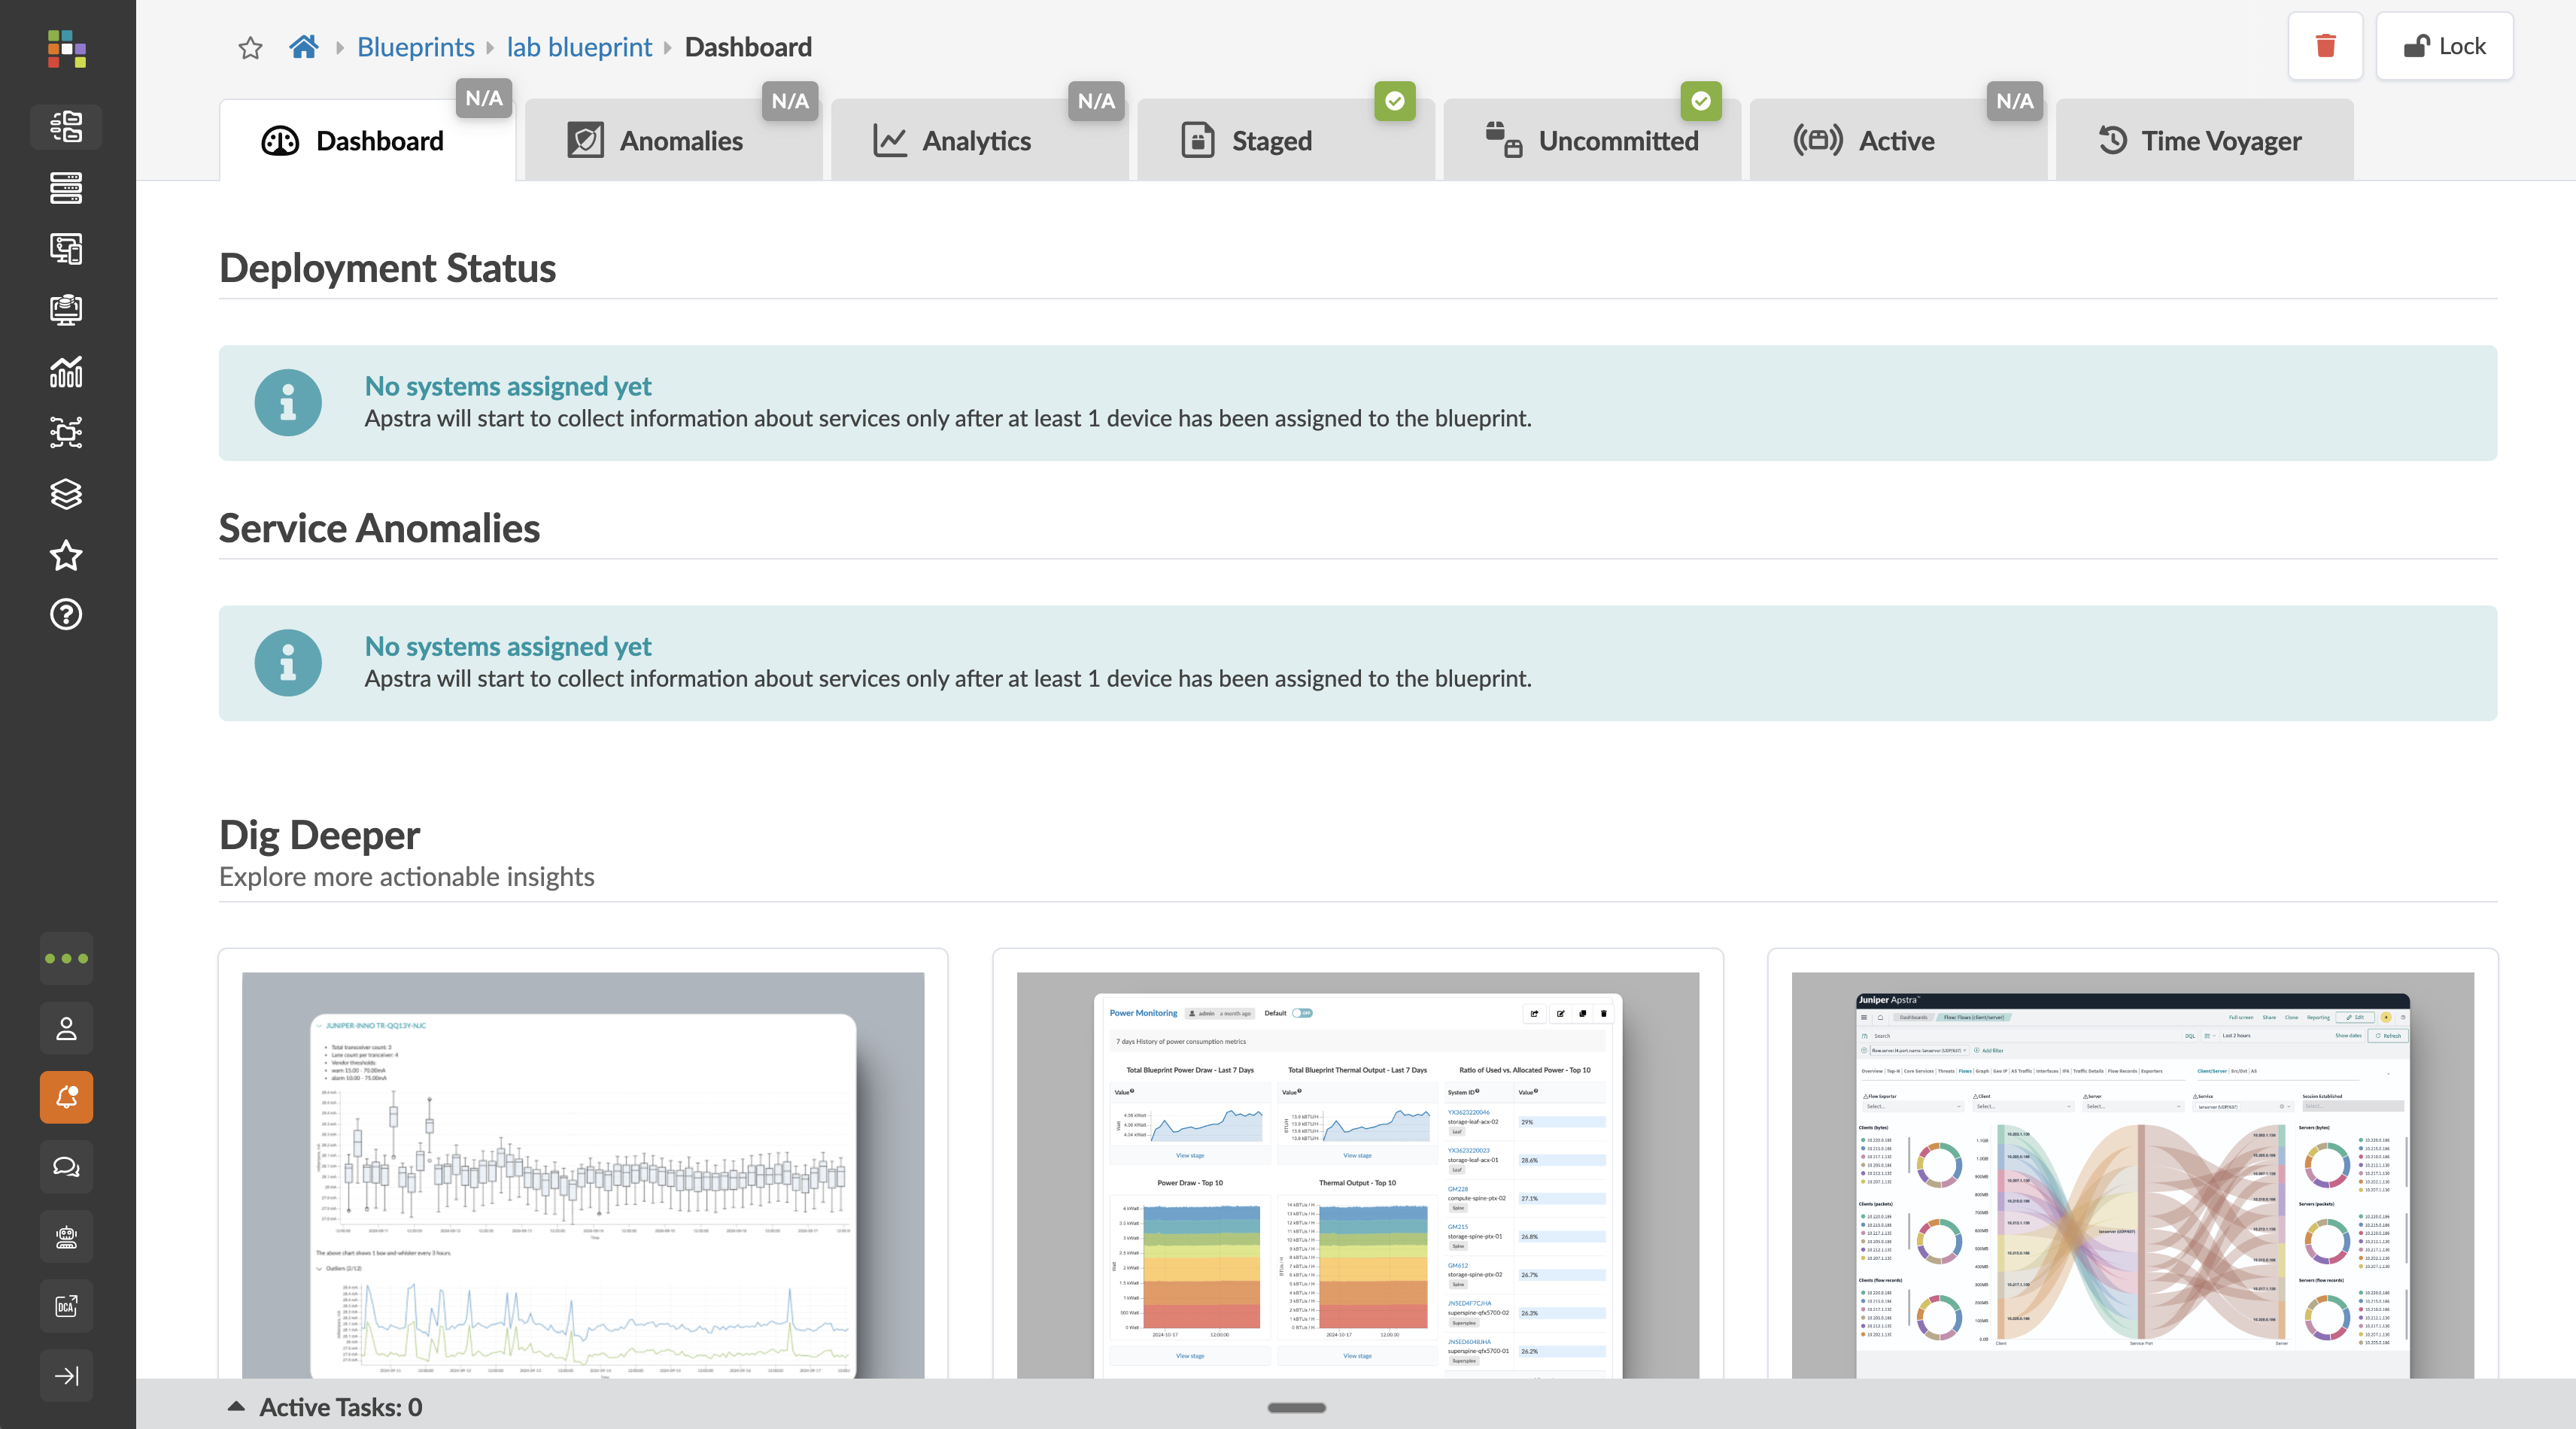
You will land on the blueprint dashboard.
Navigting the blueprint
|
Your dashbaord will show |
Exploring the topology
-
In the top tab menu, navigate to
Staged[Physical > Topology]
The topology view shows every device in the fabric and every link between them. Hover over a device to see its role, model, and current status.
-
Click on a spine switch to open its detail panel.
You are about to see something that illustrates the core difference between Apstra and traditional network management. Rather than logging into the device and running show running-config, you can view the full configuration Apstra has generated and deployed — directly from the blueprint.
-
Click the Rendered Configuration tab.
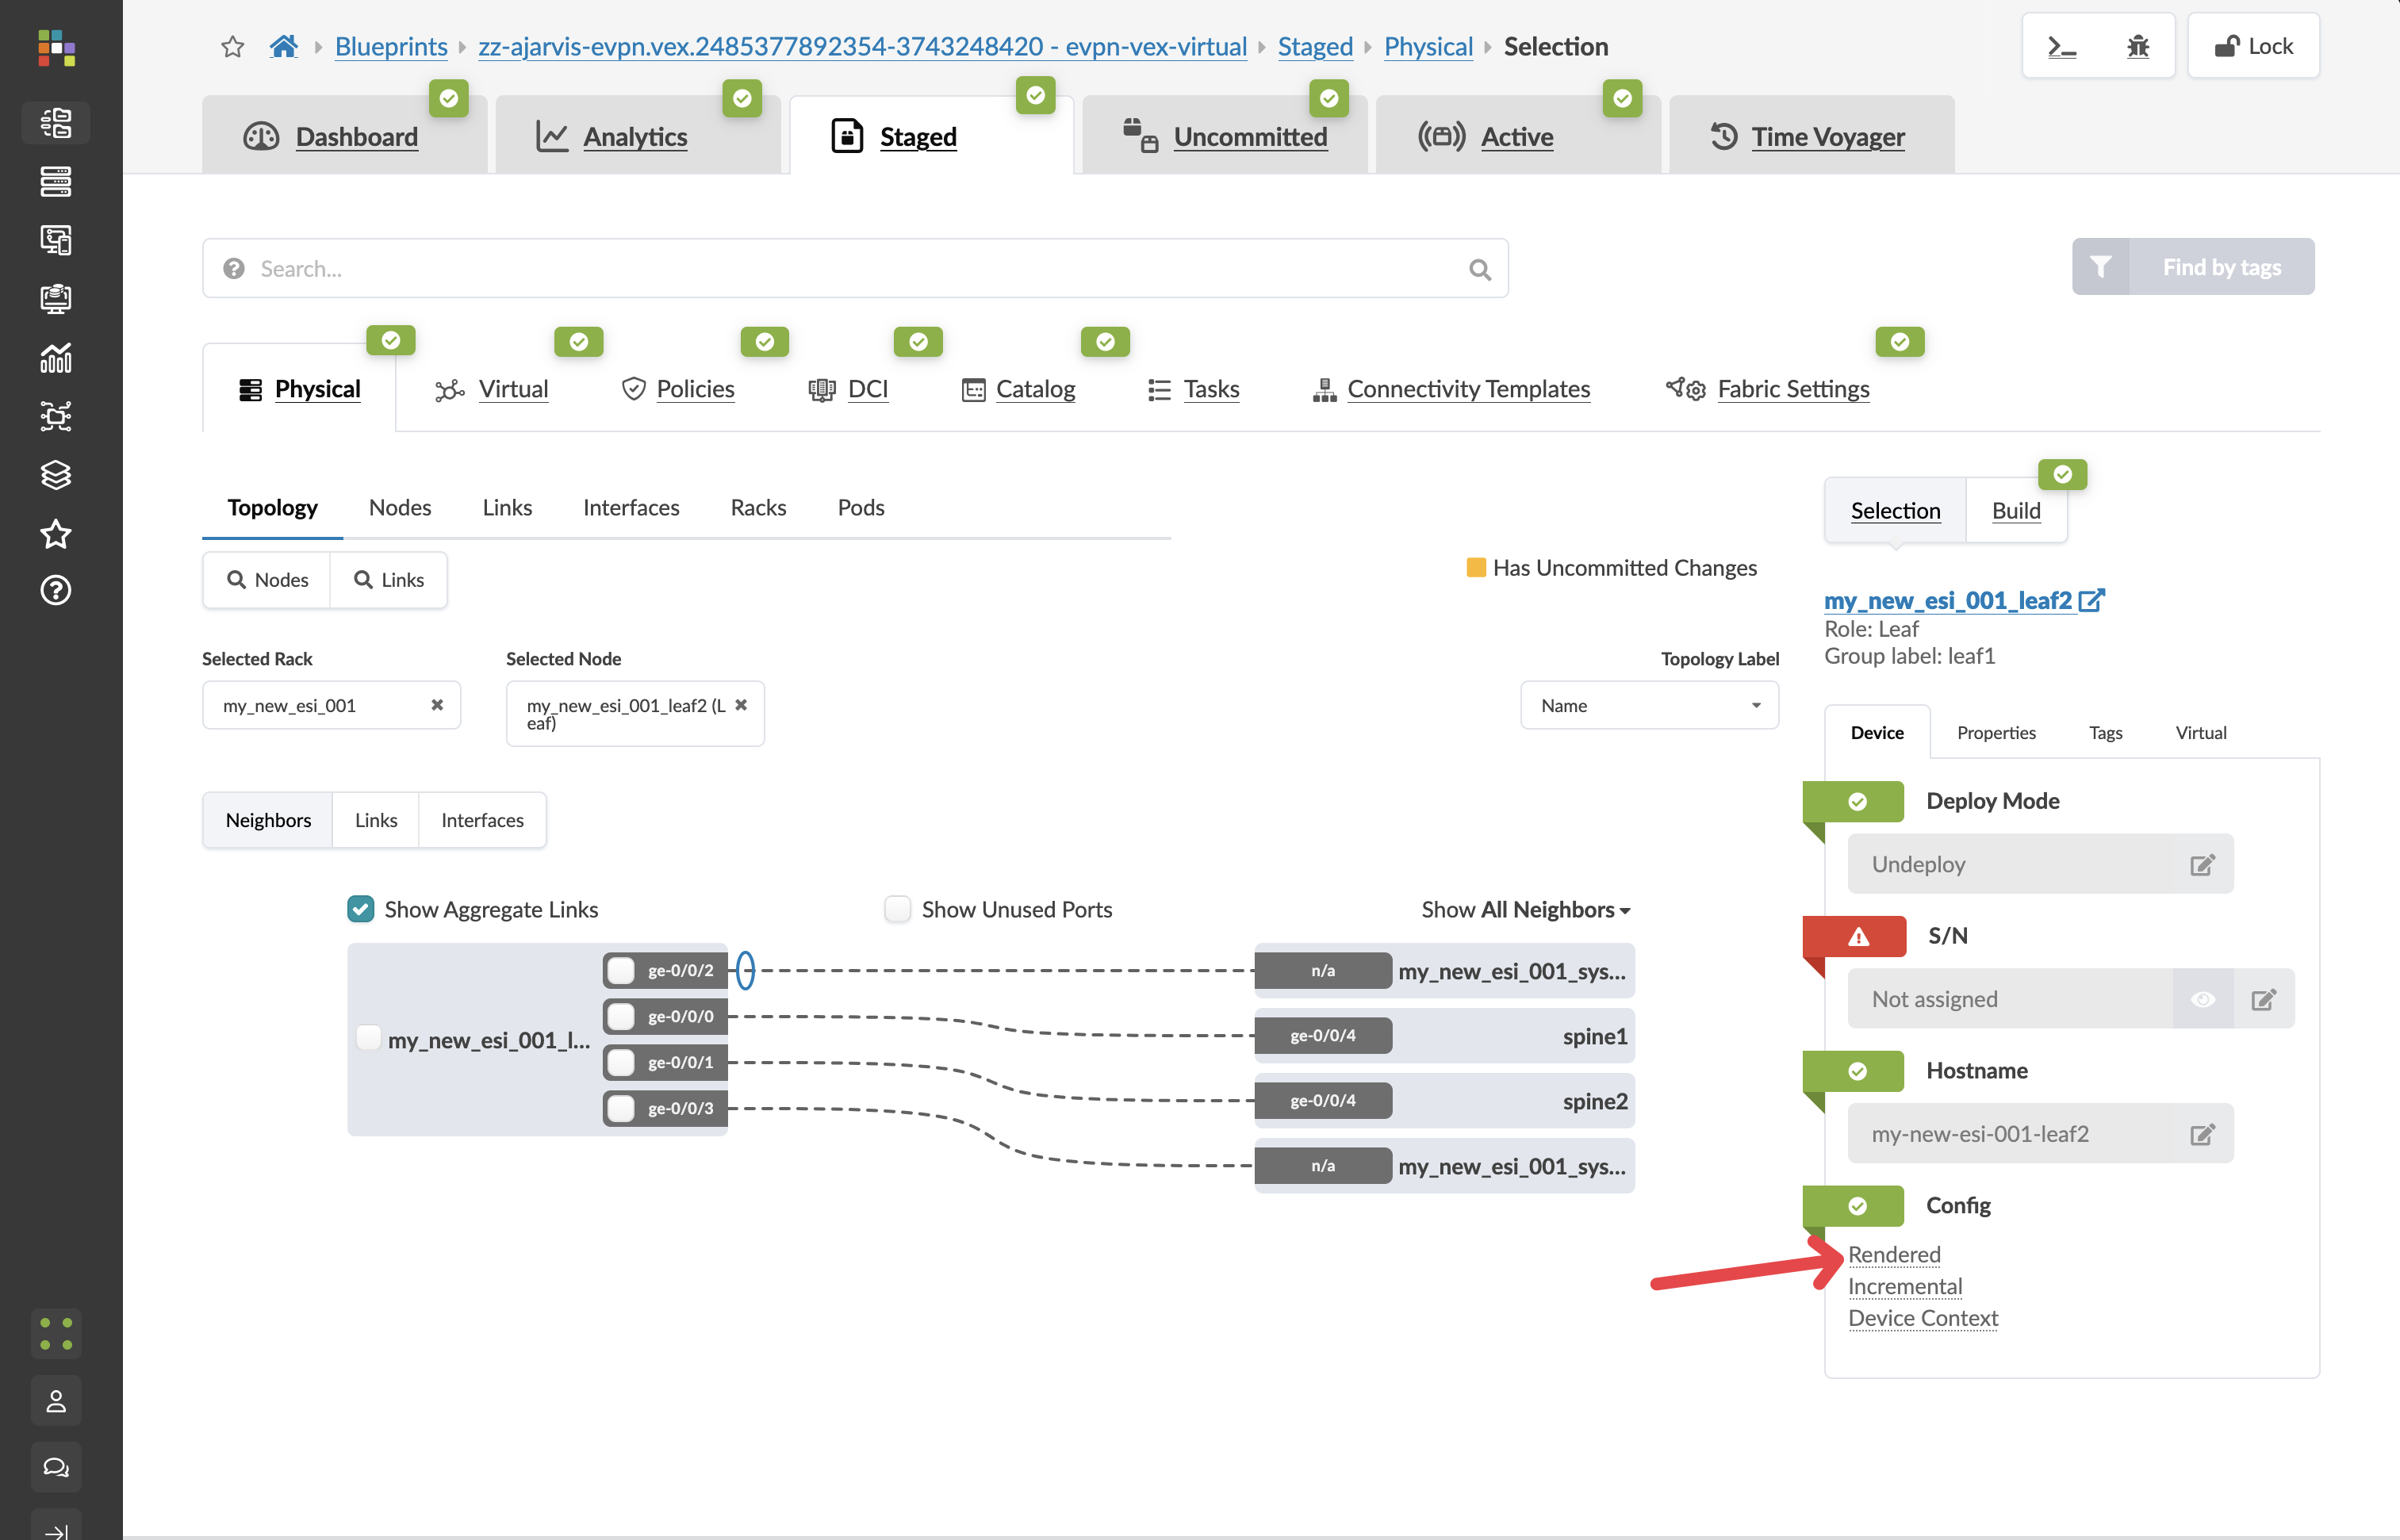
This is the complete configuration running on that device — underlay BGP, overlay EVPN, interfaces, routing policies. None of it was written by hand. It was generated from the blueprint design and pushed automatically when the fabric was built.
|
In a traditional environment, this configuration exists only as a file on the device — disconnected from any record of why it was written that way. In Apstra, every line of configuration is an expression of the blueprint. When the blueprint changes, the configuration changes with it — across every device, simultaneously. |