Section 1: The Graph Explorer
The Graph Explorer is the interactive interface for your blueprint’s graph database. It is where you will run every query in this guide. Before writing a single line of query syntax, spend a few minutes with the UI itself — understanding the controls will save you significant frustration later.
Getting there
From inside your blueprint, navigate to Platform > Developers > Graph Explorer in the left-hand navigation.

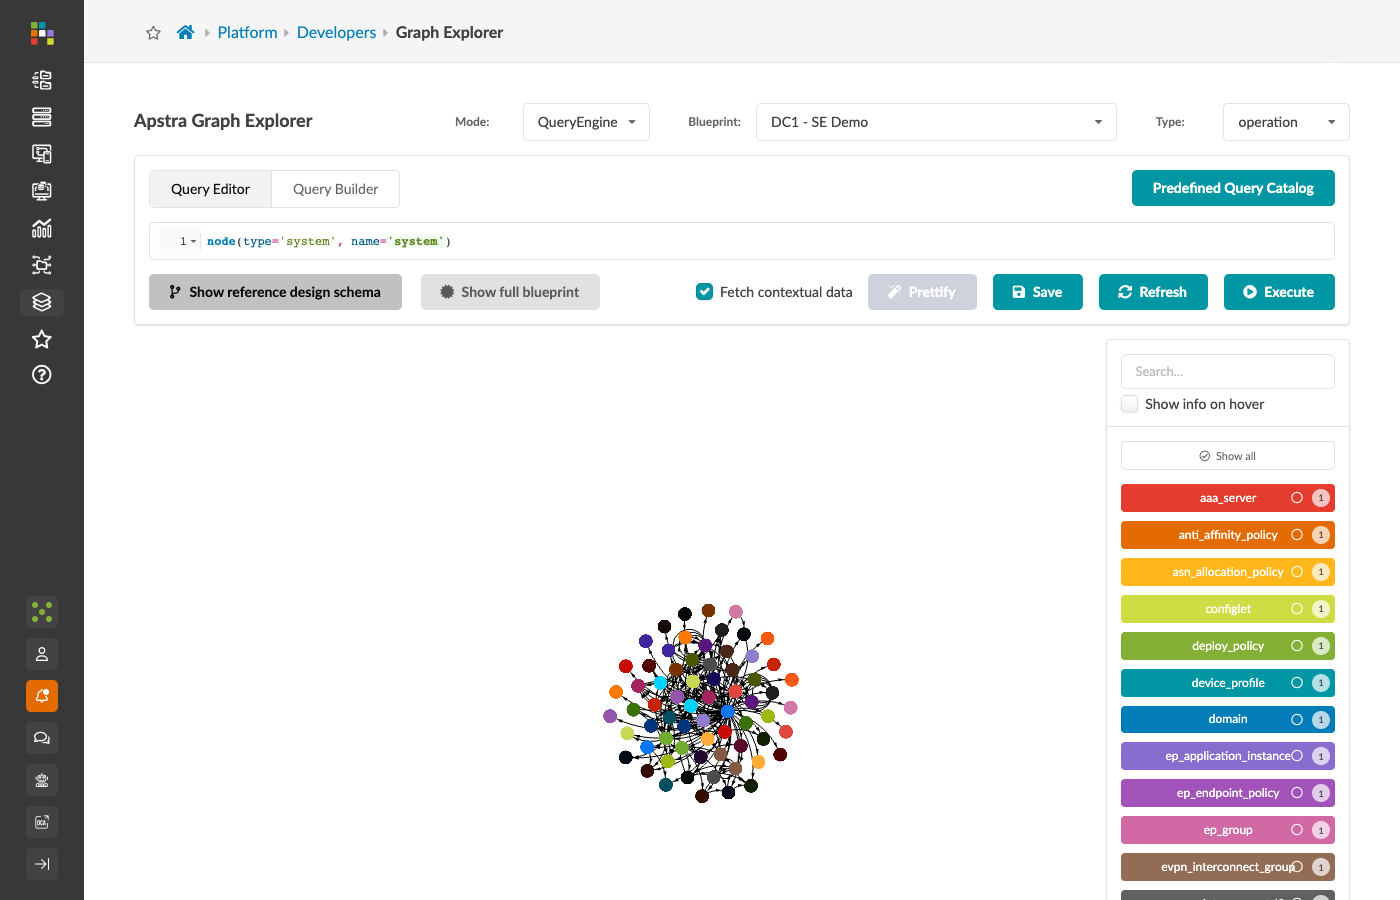
You land on the canvas view of the full graph.
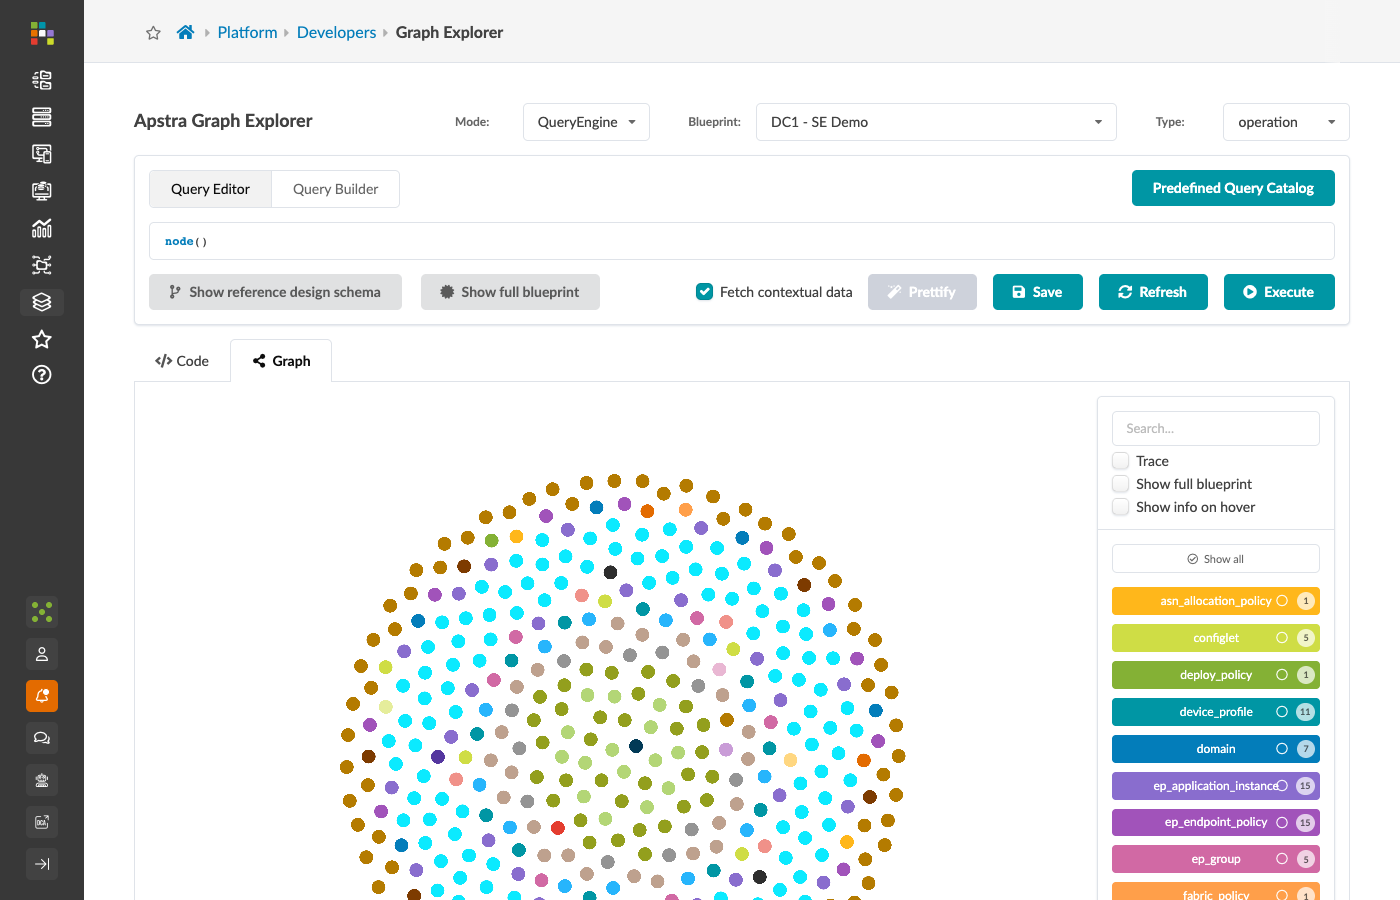
This is every node and every relationship in your blueprint, rendered simultaneously. It is intentionally overwhelming at first. The value of this view is not the full picture — it is the ability to zoom in, filter, and isolate exactly what you need.
Blueprint and mode selectors
At the top of the screen, confirm that you have the correct blueprint selected, the Mode is set to QueryEngine, and the Type is set to operation.

-
Mode: QueryEngine — the query language engine. This is the correct mode for all queries in this guide. Leave it set to QueryEngine.
-
Type: operation — queries your current staged blueprint (the design you are working on). This is what you want for almost all queries. If you need to query the live deployed state of the network, change Type to config.
The node type panel
On the right-hand side of the canvas, find the node type panel.
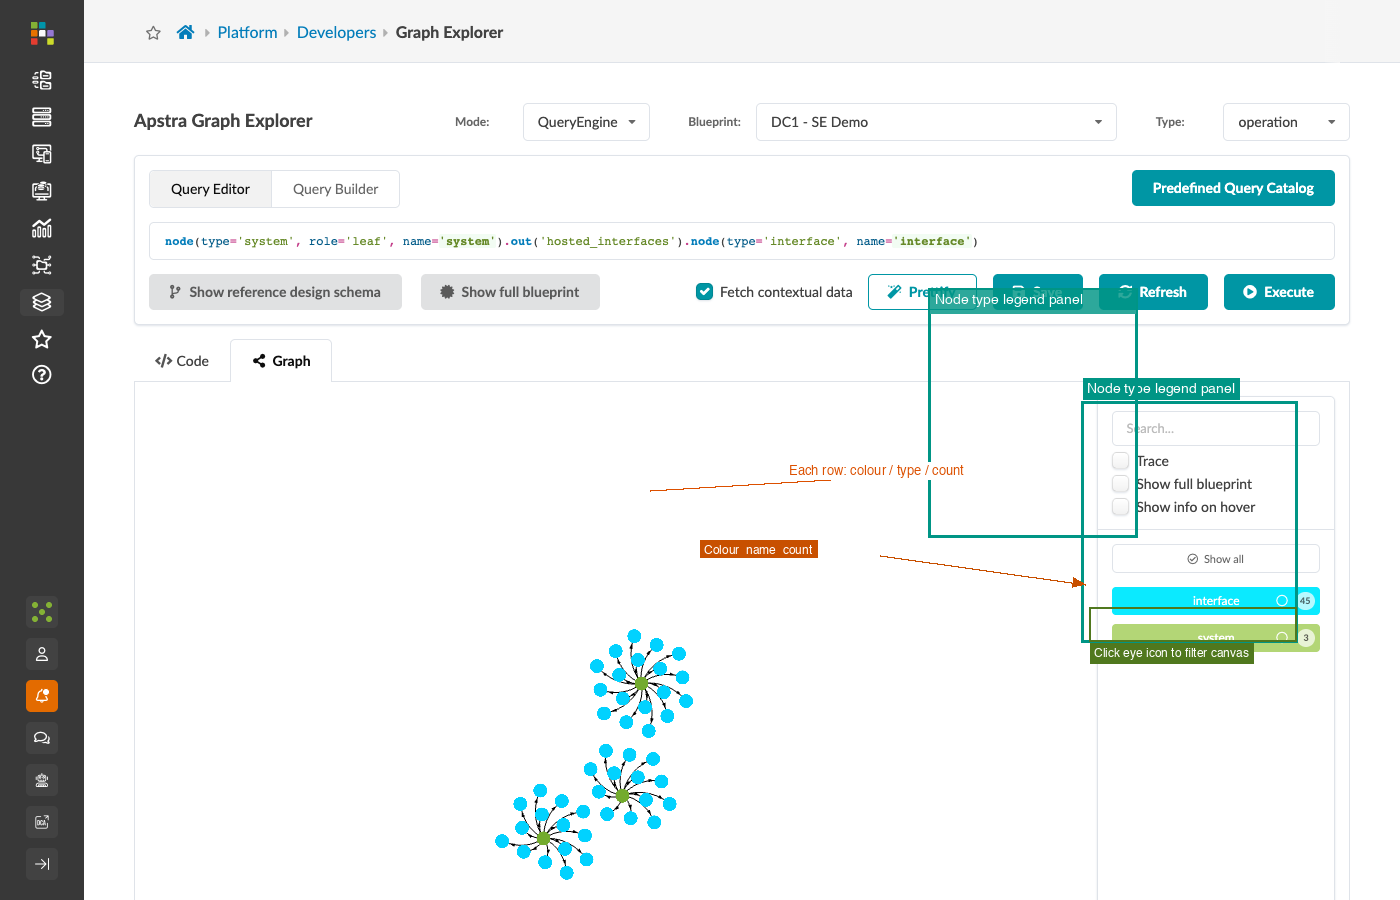
This panel lists every node type present in the current blueprint, along with:
-
A colour swatch — the colour of that type’s dots on the canvas.
-
A visibility toggle — click to show or hide all nodes of that type.
-
A count — the total number of nodes of that type in the blueprint.
Use the toggles to reduce clutter. If you are only interested in systems and interfaces, toggle off everything else. The canvas updates immediately.
|
The type panel is also your first inventory of what is in the blueprint.
If |
Hover and click to inspect
Before running queries, learn how to read individual nodes and relationships directly from the canvas.
Inspect a node
-
Point your mouse at any coloured dot. The dot’s label appears next to it.
-
Click the dot. A detail panel opens showing every property of that node and its value.
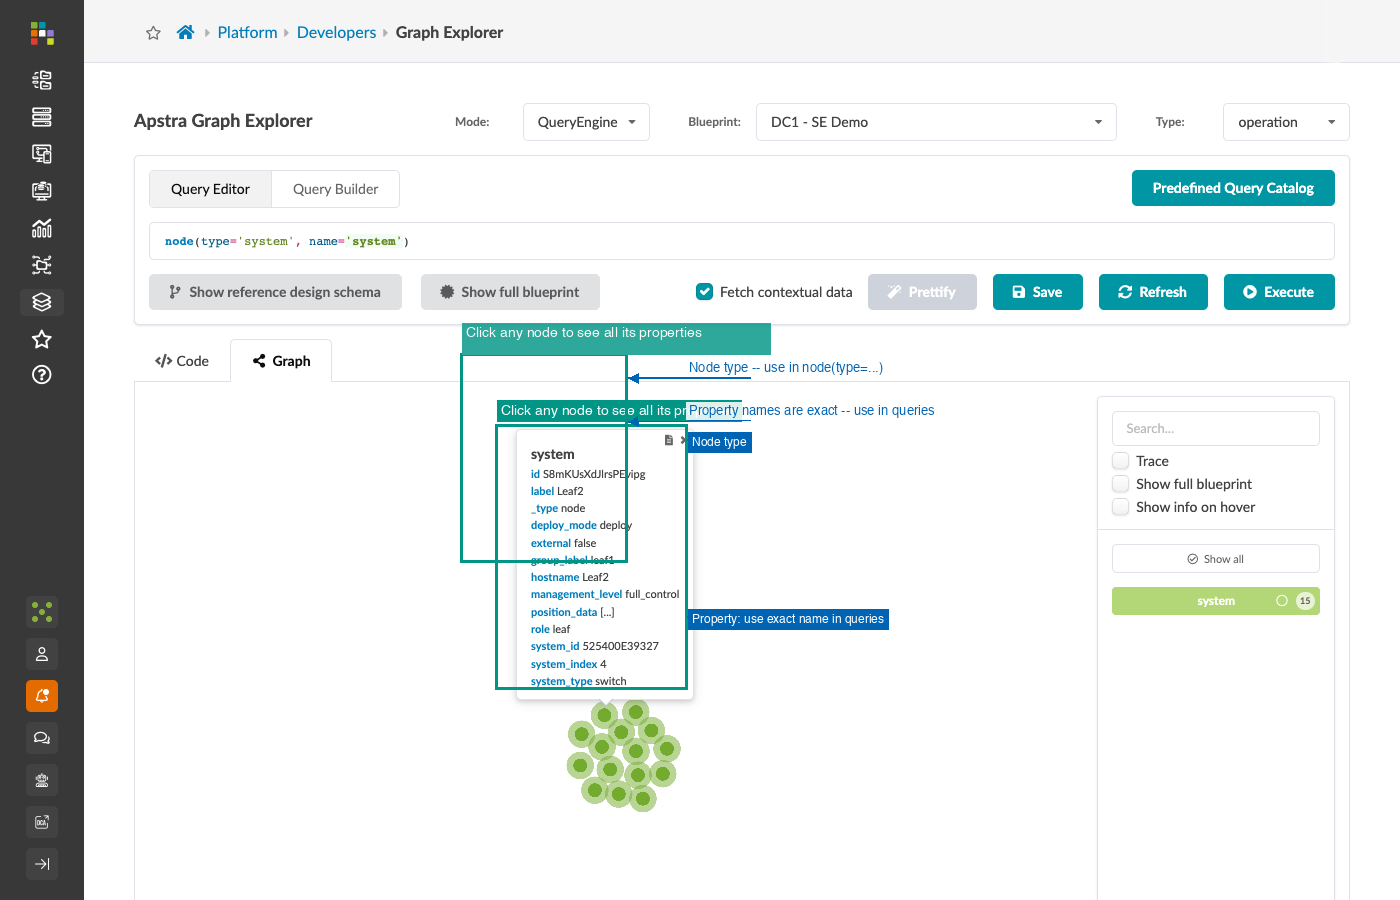
Everything you see here is a property you can filter on in a query. Property names are shown in the detail panel exactly as you would type them in a query — underscores included.
Inspect a relationship
-
Point your mouse at any line between two dots. The relationship type appears as a tooltip.
-
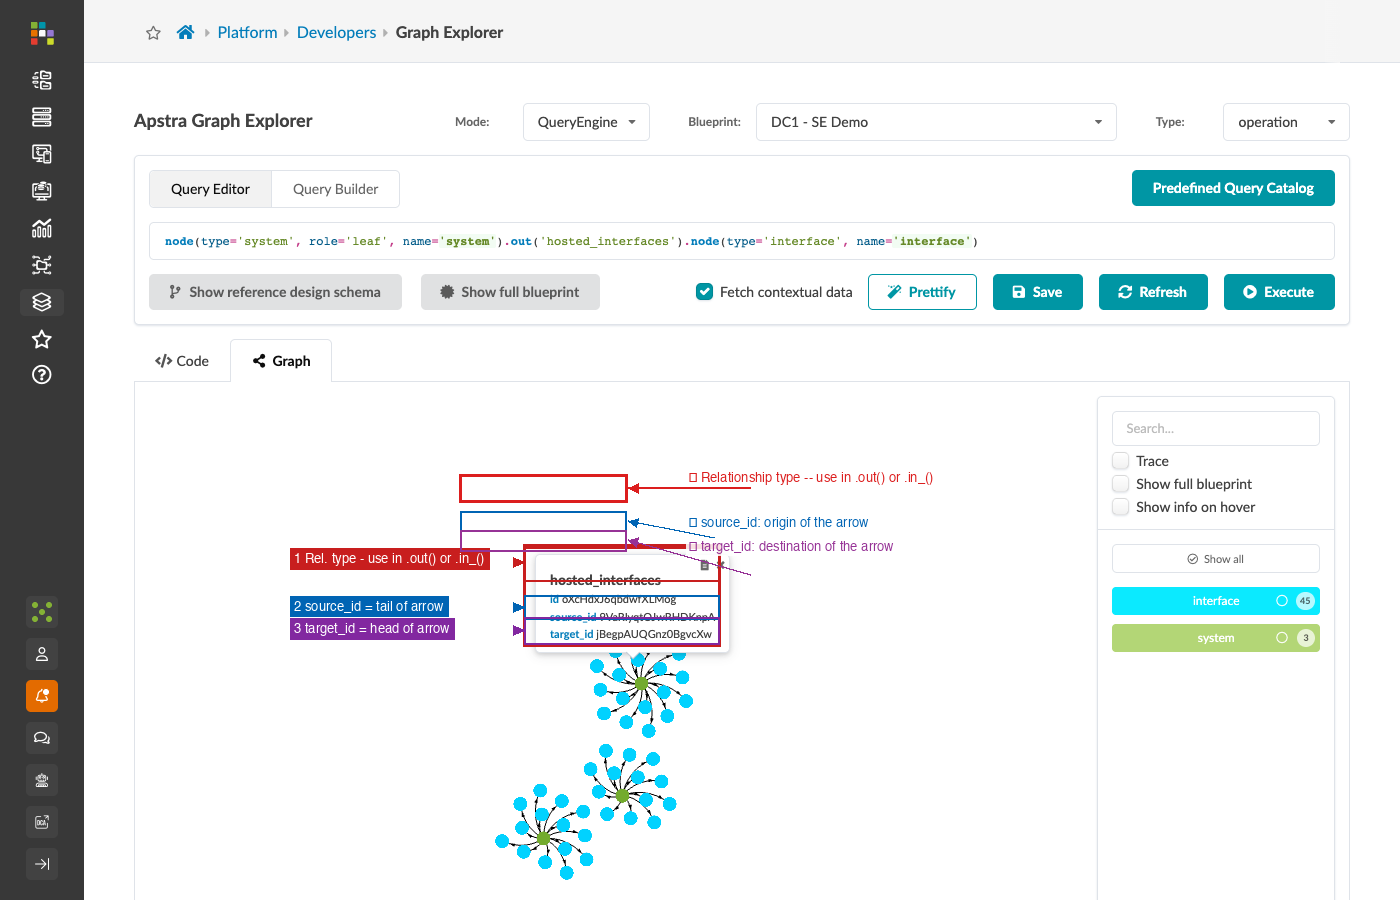
Click the line. A detail panel opens showing the type, the source node ID, and the target node ID.
|
The relationship detail panel is the authoritative source for two pieces of information you need for every traversal:
|
The Show Reference Design Schema button
Below the query editor, find the Show reference design schema button.

Clicking this overlays a simplified diagram of the main node types and the relationships between them, with arrows showing direction.
Keep this open alongside the canvas when you are building new queries. It gives you direction and type names at a glance without having to click individual relationships on the canvas.
The Query Editor
Click the Query Editor tab.
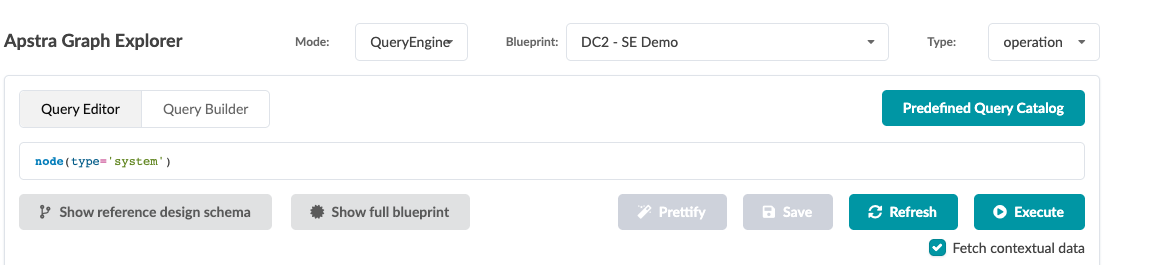
This is where you will write all queries in this guide. The editor provides:
-
Syntax highlighting — node types, property names, and function calls are colour-coded.
-
Auto-completion — press
Tabafter typing a dot to see available methods. Afternode()., you will seein_(),out(),where(), and others. After typing a node type, you will see a list of valid property names for that type. -
Prettify — formats your query with consistent indentation. Use this whenever a query becomes more than two lines.
-
Execute — runs the query and renders results on the canvas.
-
Save — opens a dialog to add the query to the Predefined Query Catalog.
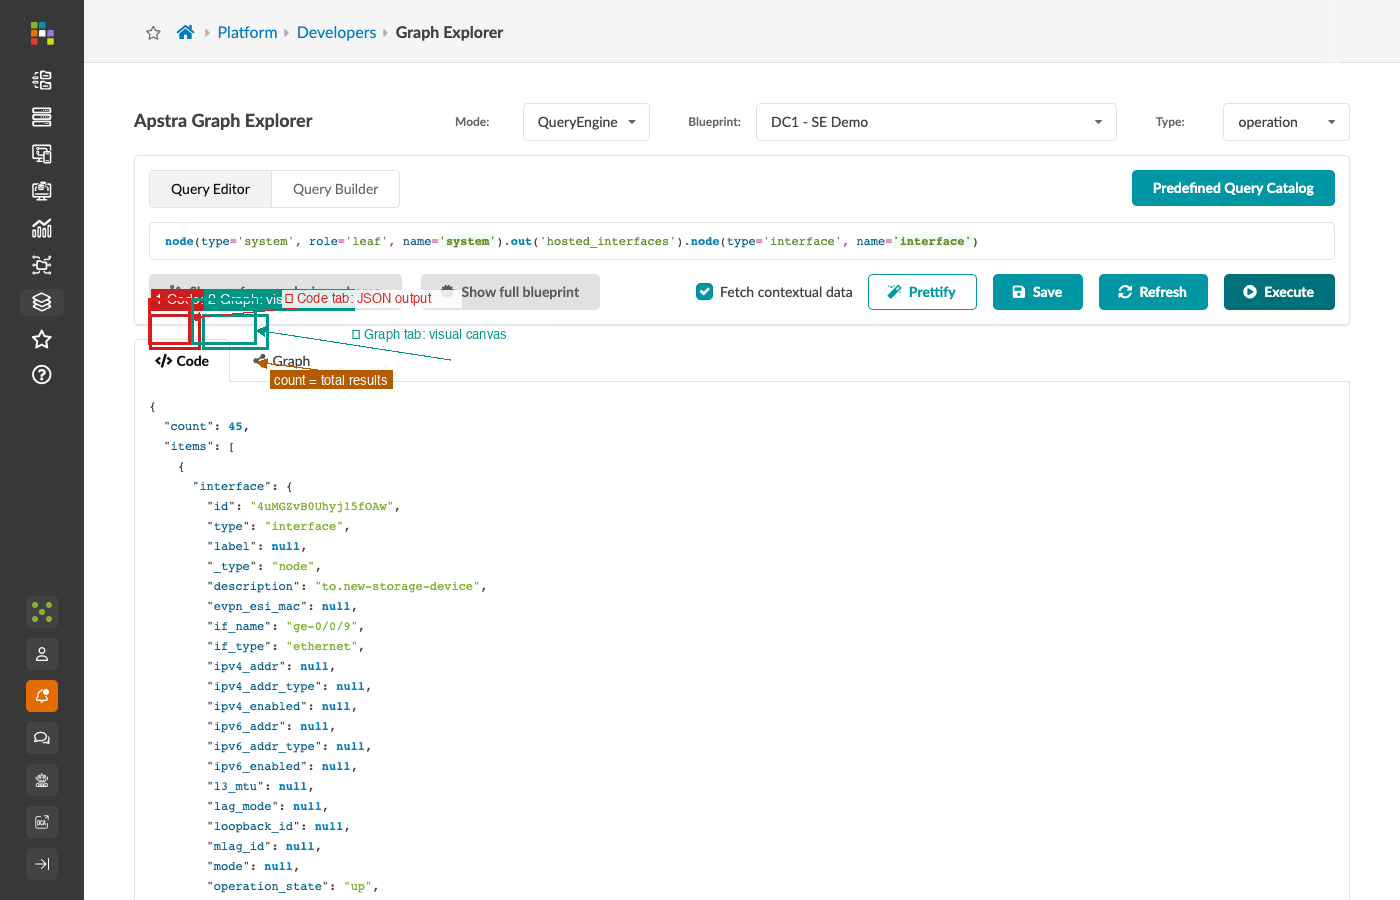
Results appear both visually on the Graph tab and as JSON in the Code tab below the editor.
The Query Builder
The Query Builder tab offers a graphical alternative to writing queries by hand.
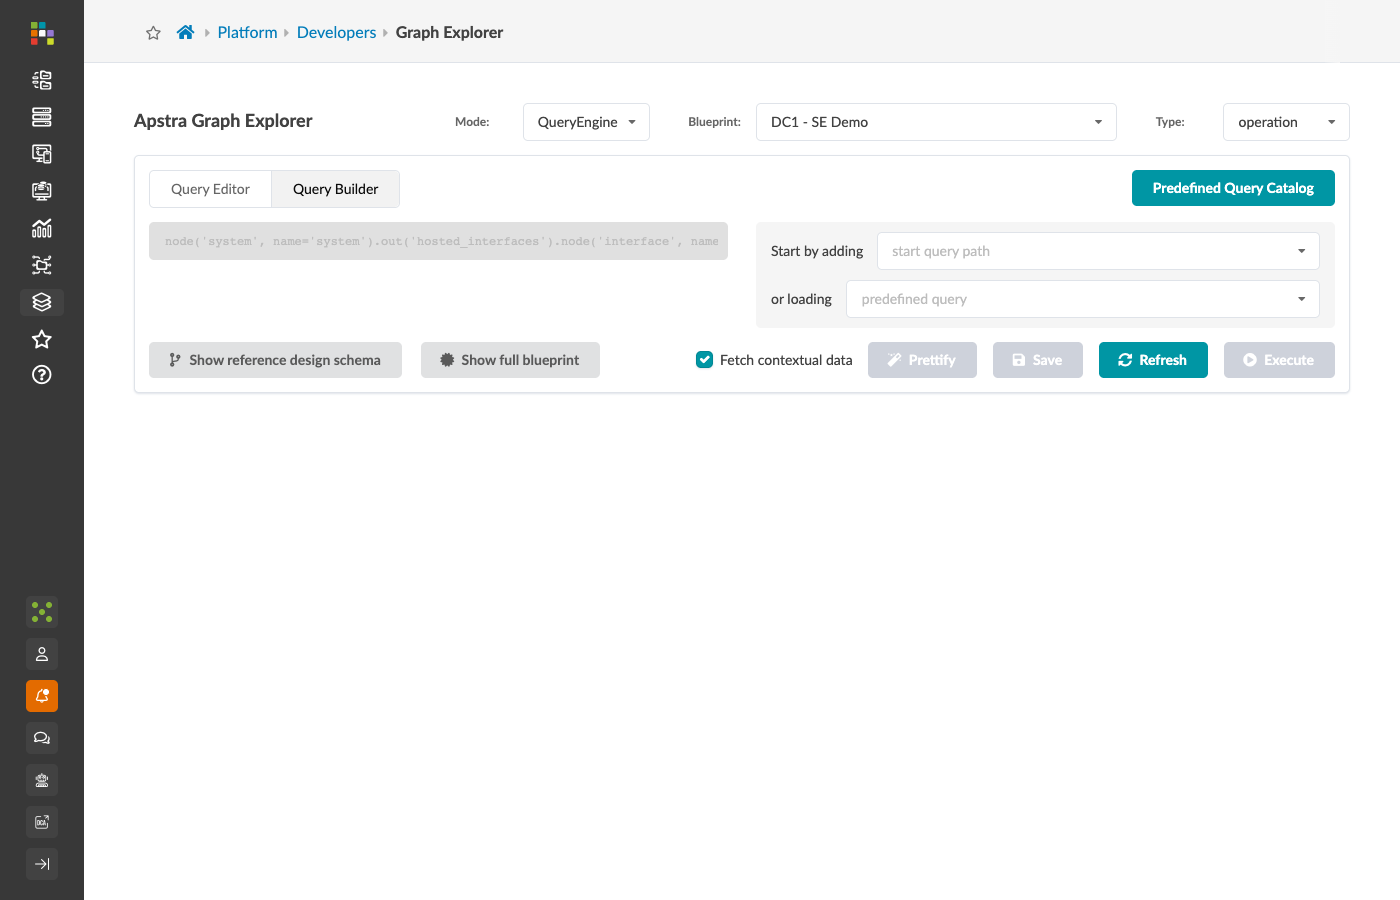
Select a node type from the dropdown, add attribute filters using the form fields, then add a relationship and a further node to build a traversal without typing. The Query Builder writes the query text in the Query Editor simultaneously — switch tabs to read it.
The Query Builder is most useful for:
-
Discovering what properties are available for a given node type without opening a detail panel.
-
Learning query syntax by reading what the builder generates.
-
Constructing simple single-node filters quickly.
For traversals, intersections, lambdas, and anything involving match() or optional(), you will use the Query Editor directly.
The Predefined Query Catalog
Click the Predefined Query Catalog button in the top-right corner.
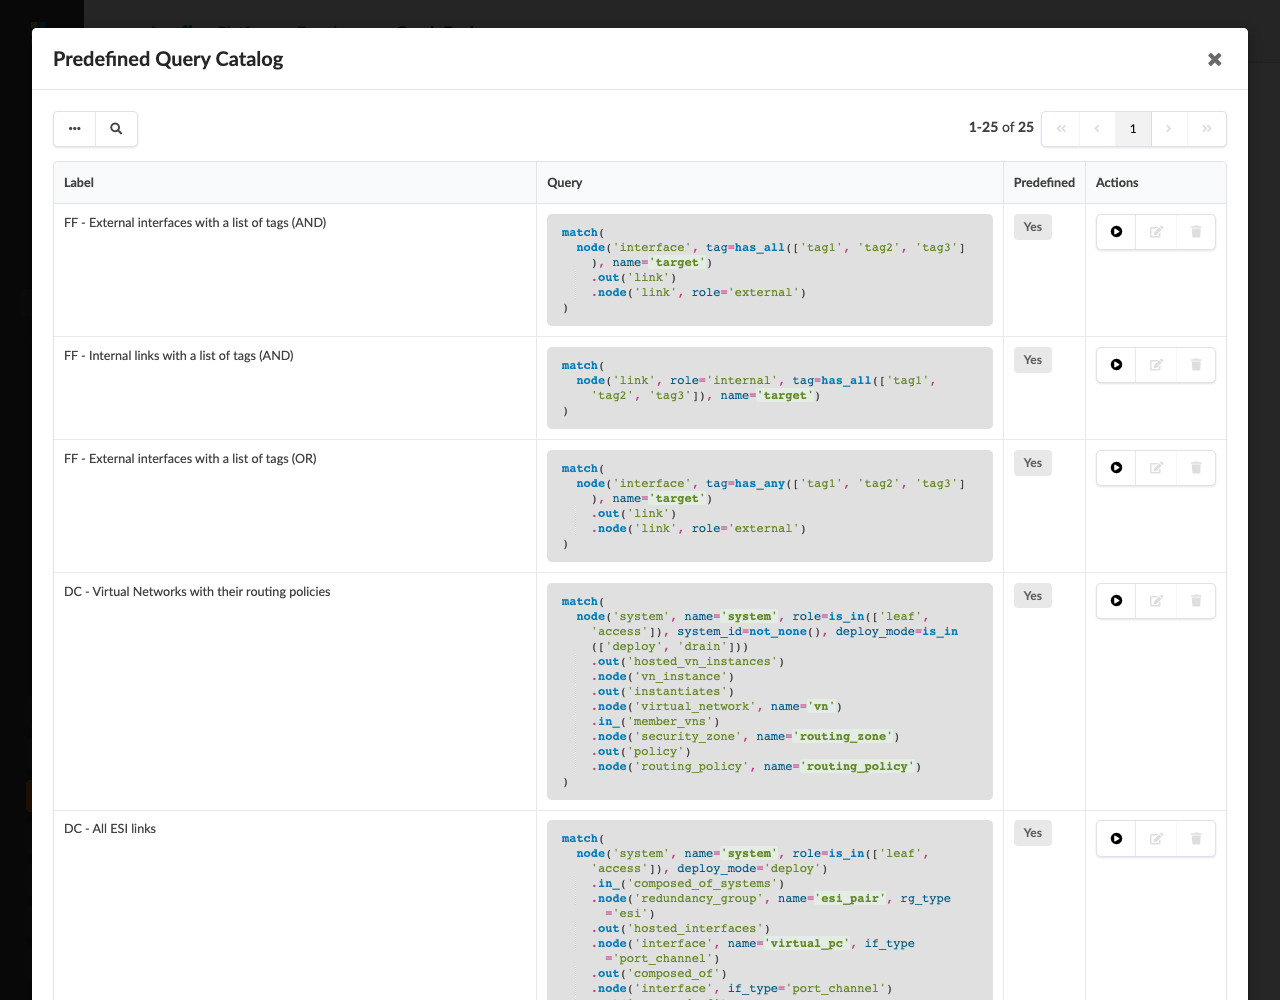
Apstra ships 25 predefined queries. For a three-stage reference design fabric, the relevant ones are prefixed DC -. These cover common operational patterns: finding all deployed devices, all fabric interfaces, all virtual networks and their associated routing policies, and ESI link pairs.
|
Treat the catalog as a learning library, not just a shortcut. When you encounter a technique in this guide and want to see a real example of it in context, open the catalog, find a DC- query that uses that technique, and read through it line by line. The catalog entries use every property matcher, every traversal pattern, and every advanced construct covered in this guide. |
You can save your own queries to the catalog by clicking Save in the Query Editor. Saved queries are available to all users who access the blueprint.
Orientation checkpoint
Before moving on, confirm the Explorer is working correctly:
-
Type
node()in the Query Editor and click Execute. You should see a large cloud of coloured dots appear on the canvas. -
Click one dot. Confirm the detail panel opens.
-
Click one relationship line. Confirm the type and source/target IDs are visible in the detail panel.
-
Open the Predefined Query Catalog. Find the entry labelled DC - All managed devices (any role) and read through the query. Do not worry if it is not fully clear yet — you will understand every part of it by the end of Section 4.
If the canvas remains empty after executing node(), check that your blueprint is deployed and that the Mode is set to QueryEngine with Type set to operation.
Continue to Section 2: Querying Nodes.