Demo 2 - Correlated visibility
This is the second of three scenarios. Now that you understand how DC Assurance measures network health through SLEs, this scenario shows how the platform correlates infrastructure and traffic data in a single view. It addresses a problem that is common in network operations: topology data lives in one tool, traffic data in another, and putting the picture together takes time. By the time a team has assembled a clear view, the problem has often moved on.
DC Assurance solves this by correlating Flow data against the Apstra fabric model in real time, so the combined view is always available — before anyone thinks to ask for it.
What to consider before you explore
Think about how your team investigates a performance issue today:
-
When a report comes in, how long does it typically take to work out where in the network the problem is?
-
Do you currently have a single place where you can see both your network topology and what is actually flowing through it?
-
How does the process of troubleshooting an application issue connect to your network data?
These are not hypothetical questions. They reflect the workflow DC Assurance is designed to change.
Navigating to the correlated view
Navigate to App Aware and make sure you selected SEDemoLab-DC1 – SE Demo. You are now on the combined infrastructure and Flow view.
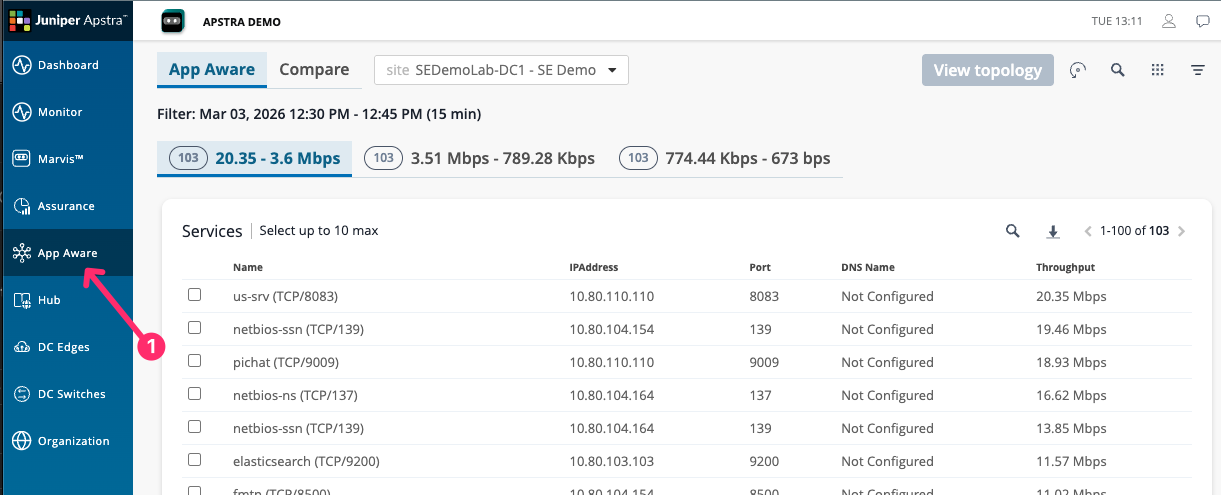
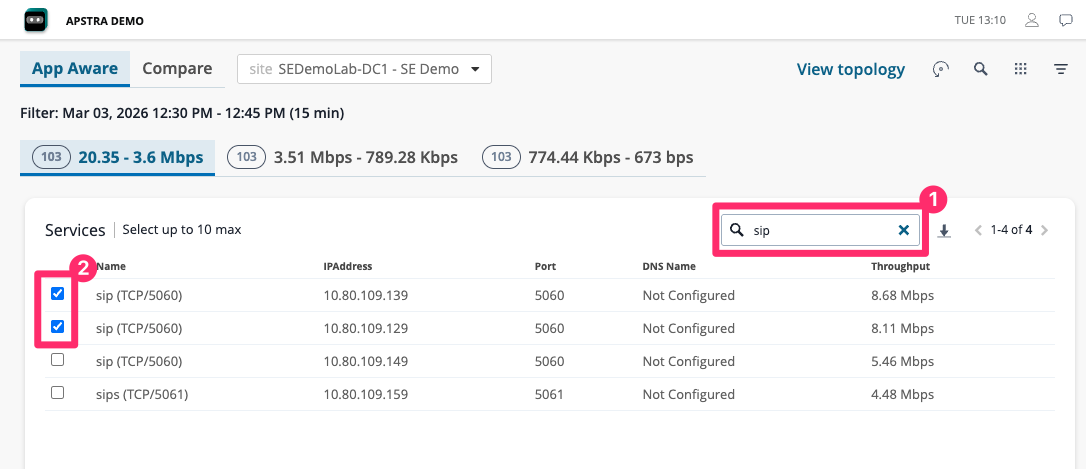
Select the servies you wish to view. You can select one, some, or all of the services in the environment. Each service corresponds to a specific instance of the service type. For example, you may have multiple instances of a SIP service, each running on different virtual machines and connected to the fabric in different ways.
Select the service you wish to view and click View Topology.
The topology will render to show the devices and links that service is using. Here you
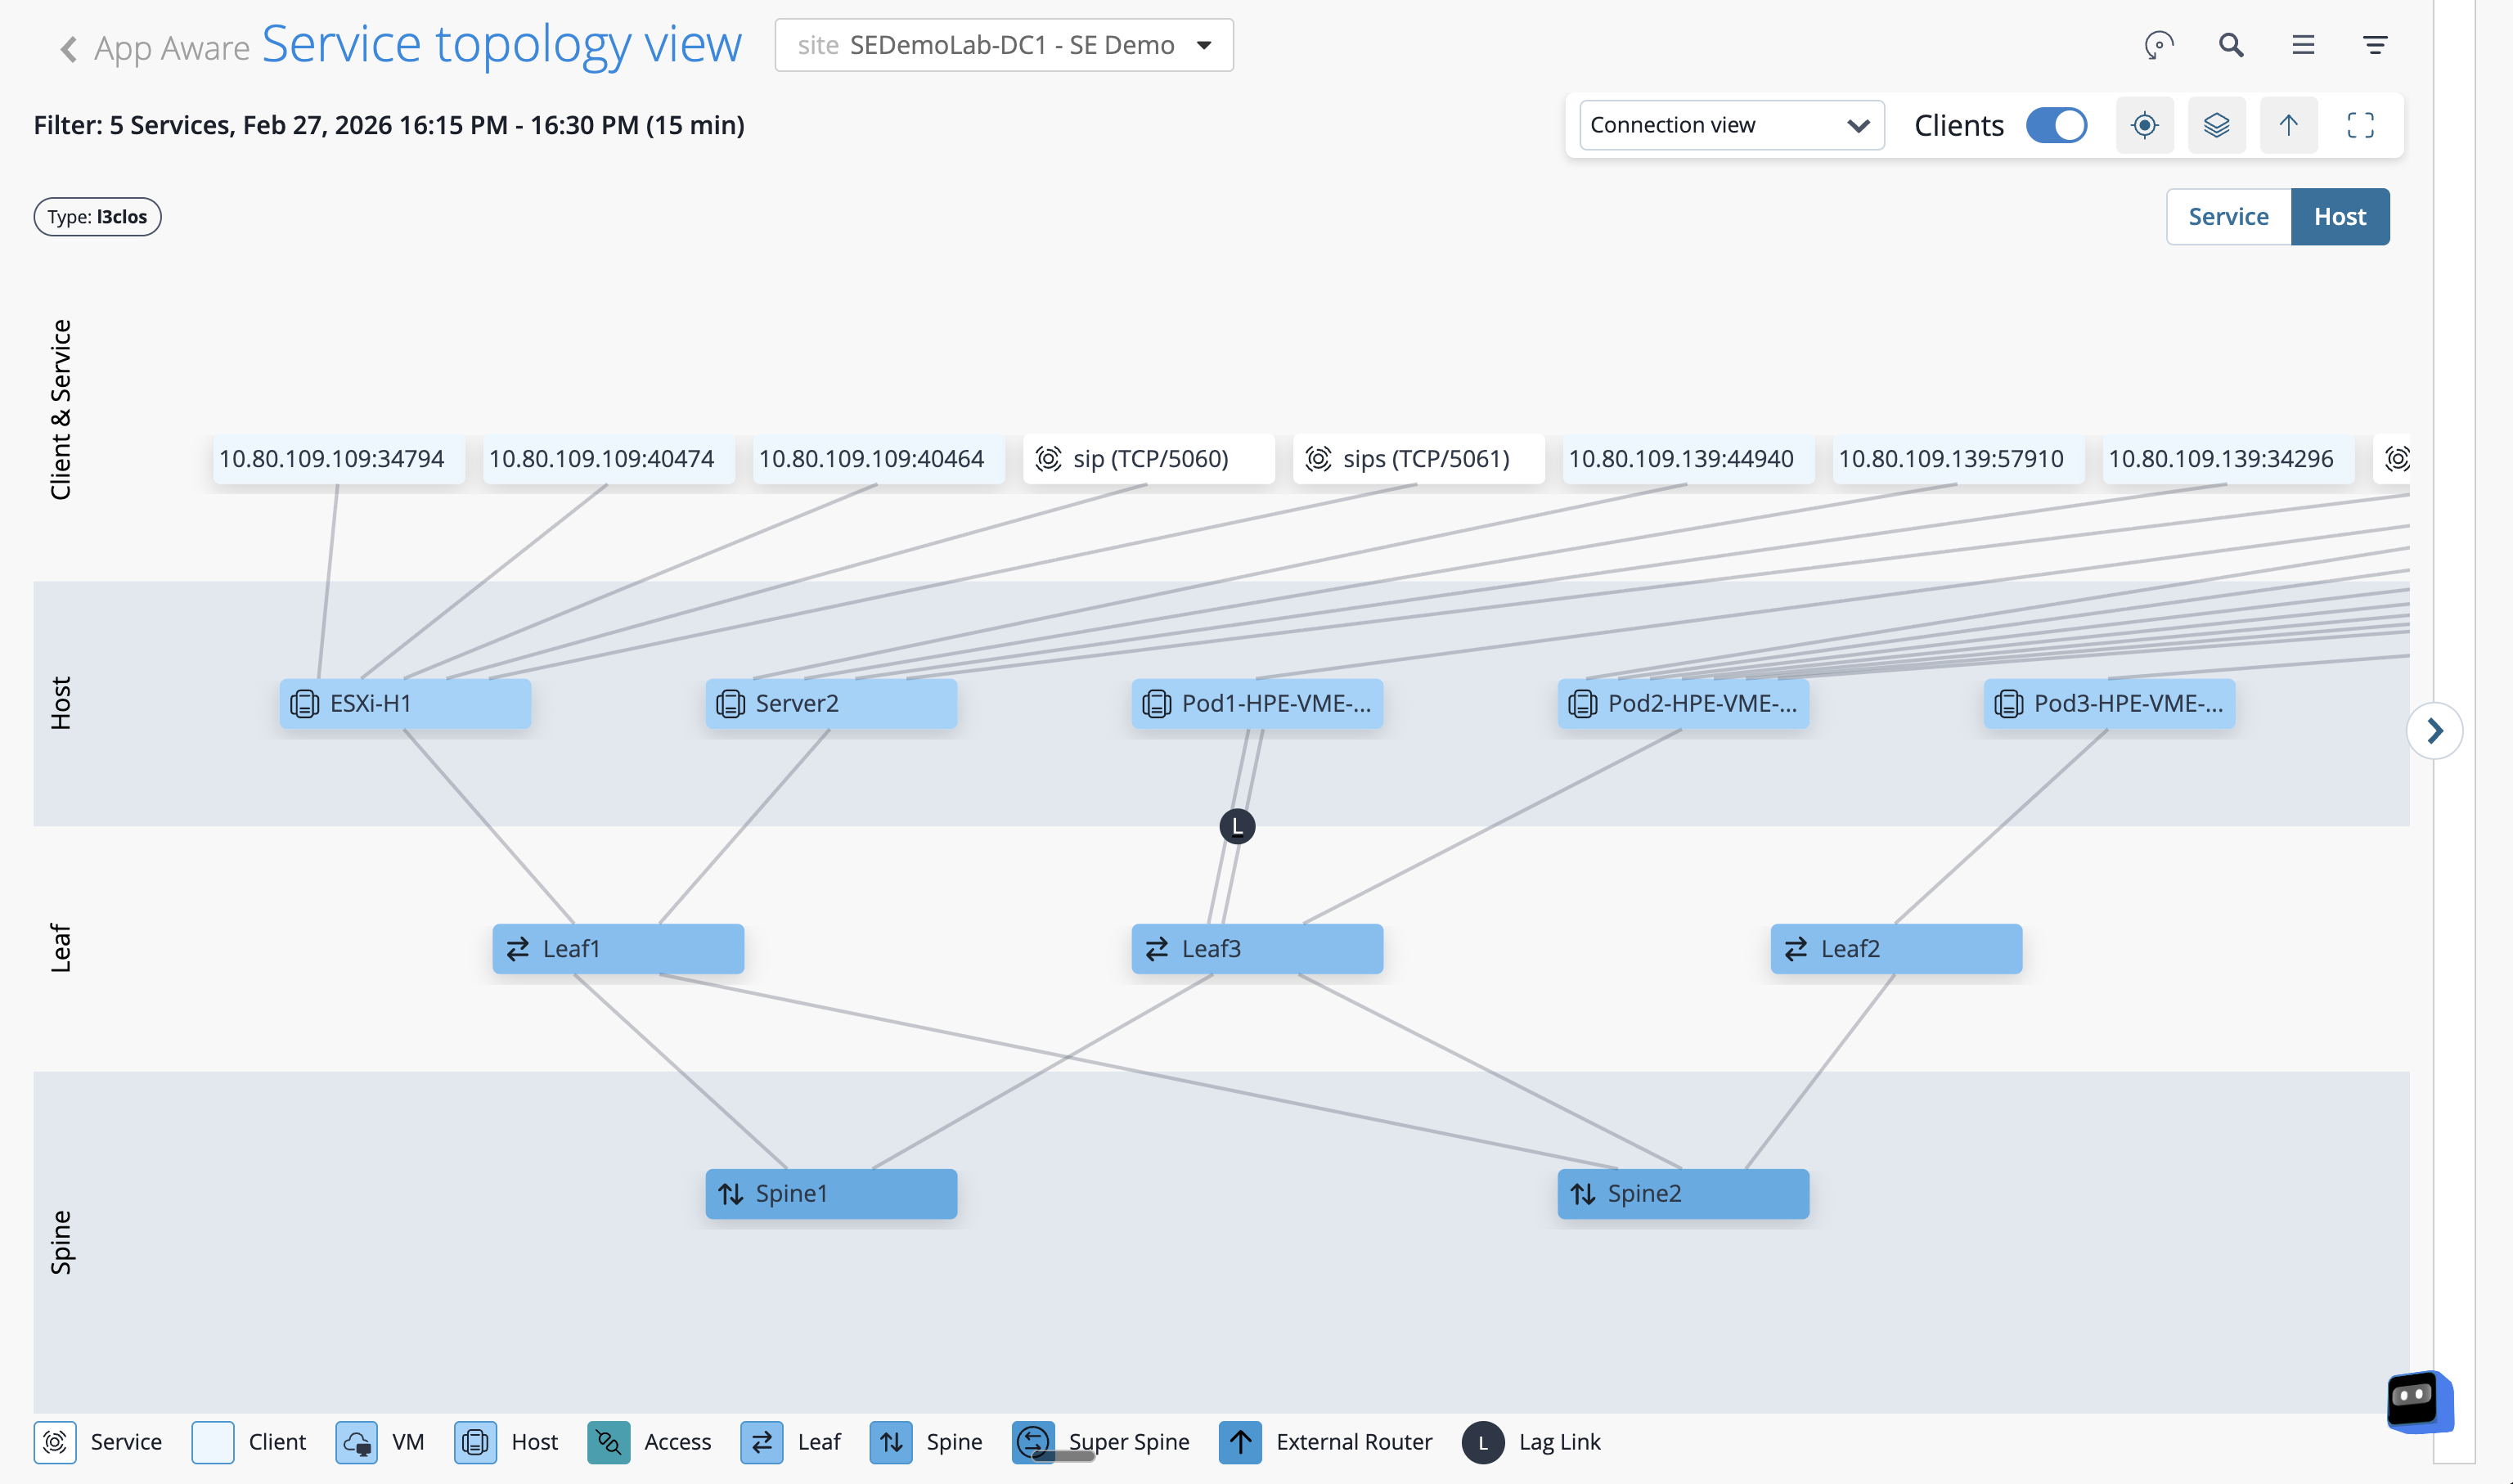
The topology and the traffic data are not separate views — they are shown together, because that is how Apstra Data Center Director’s model works. The fabric knows its own structure, so when a flow arrives, DC Assurance already knows the path it took.
You can also view the traffic flow levels plus the path a host is taking to with the service through the DC fabric.
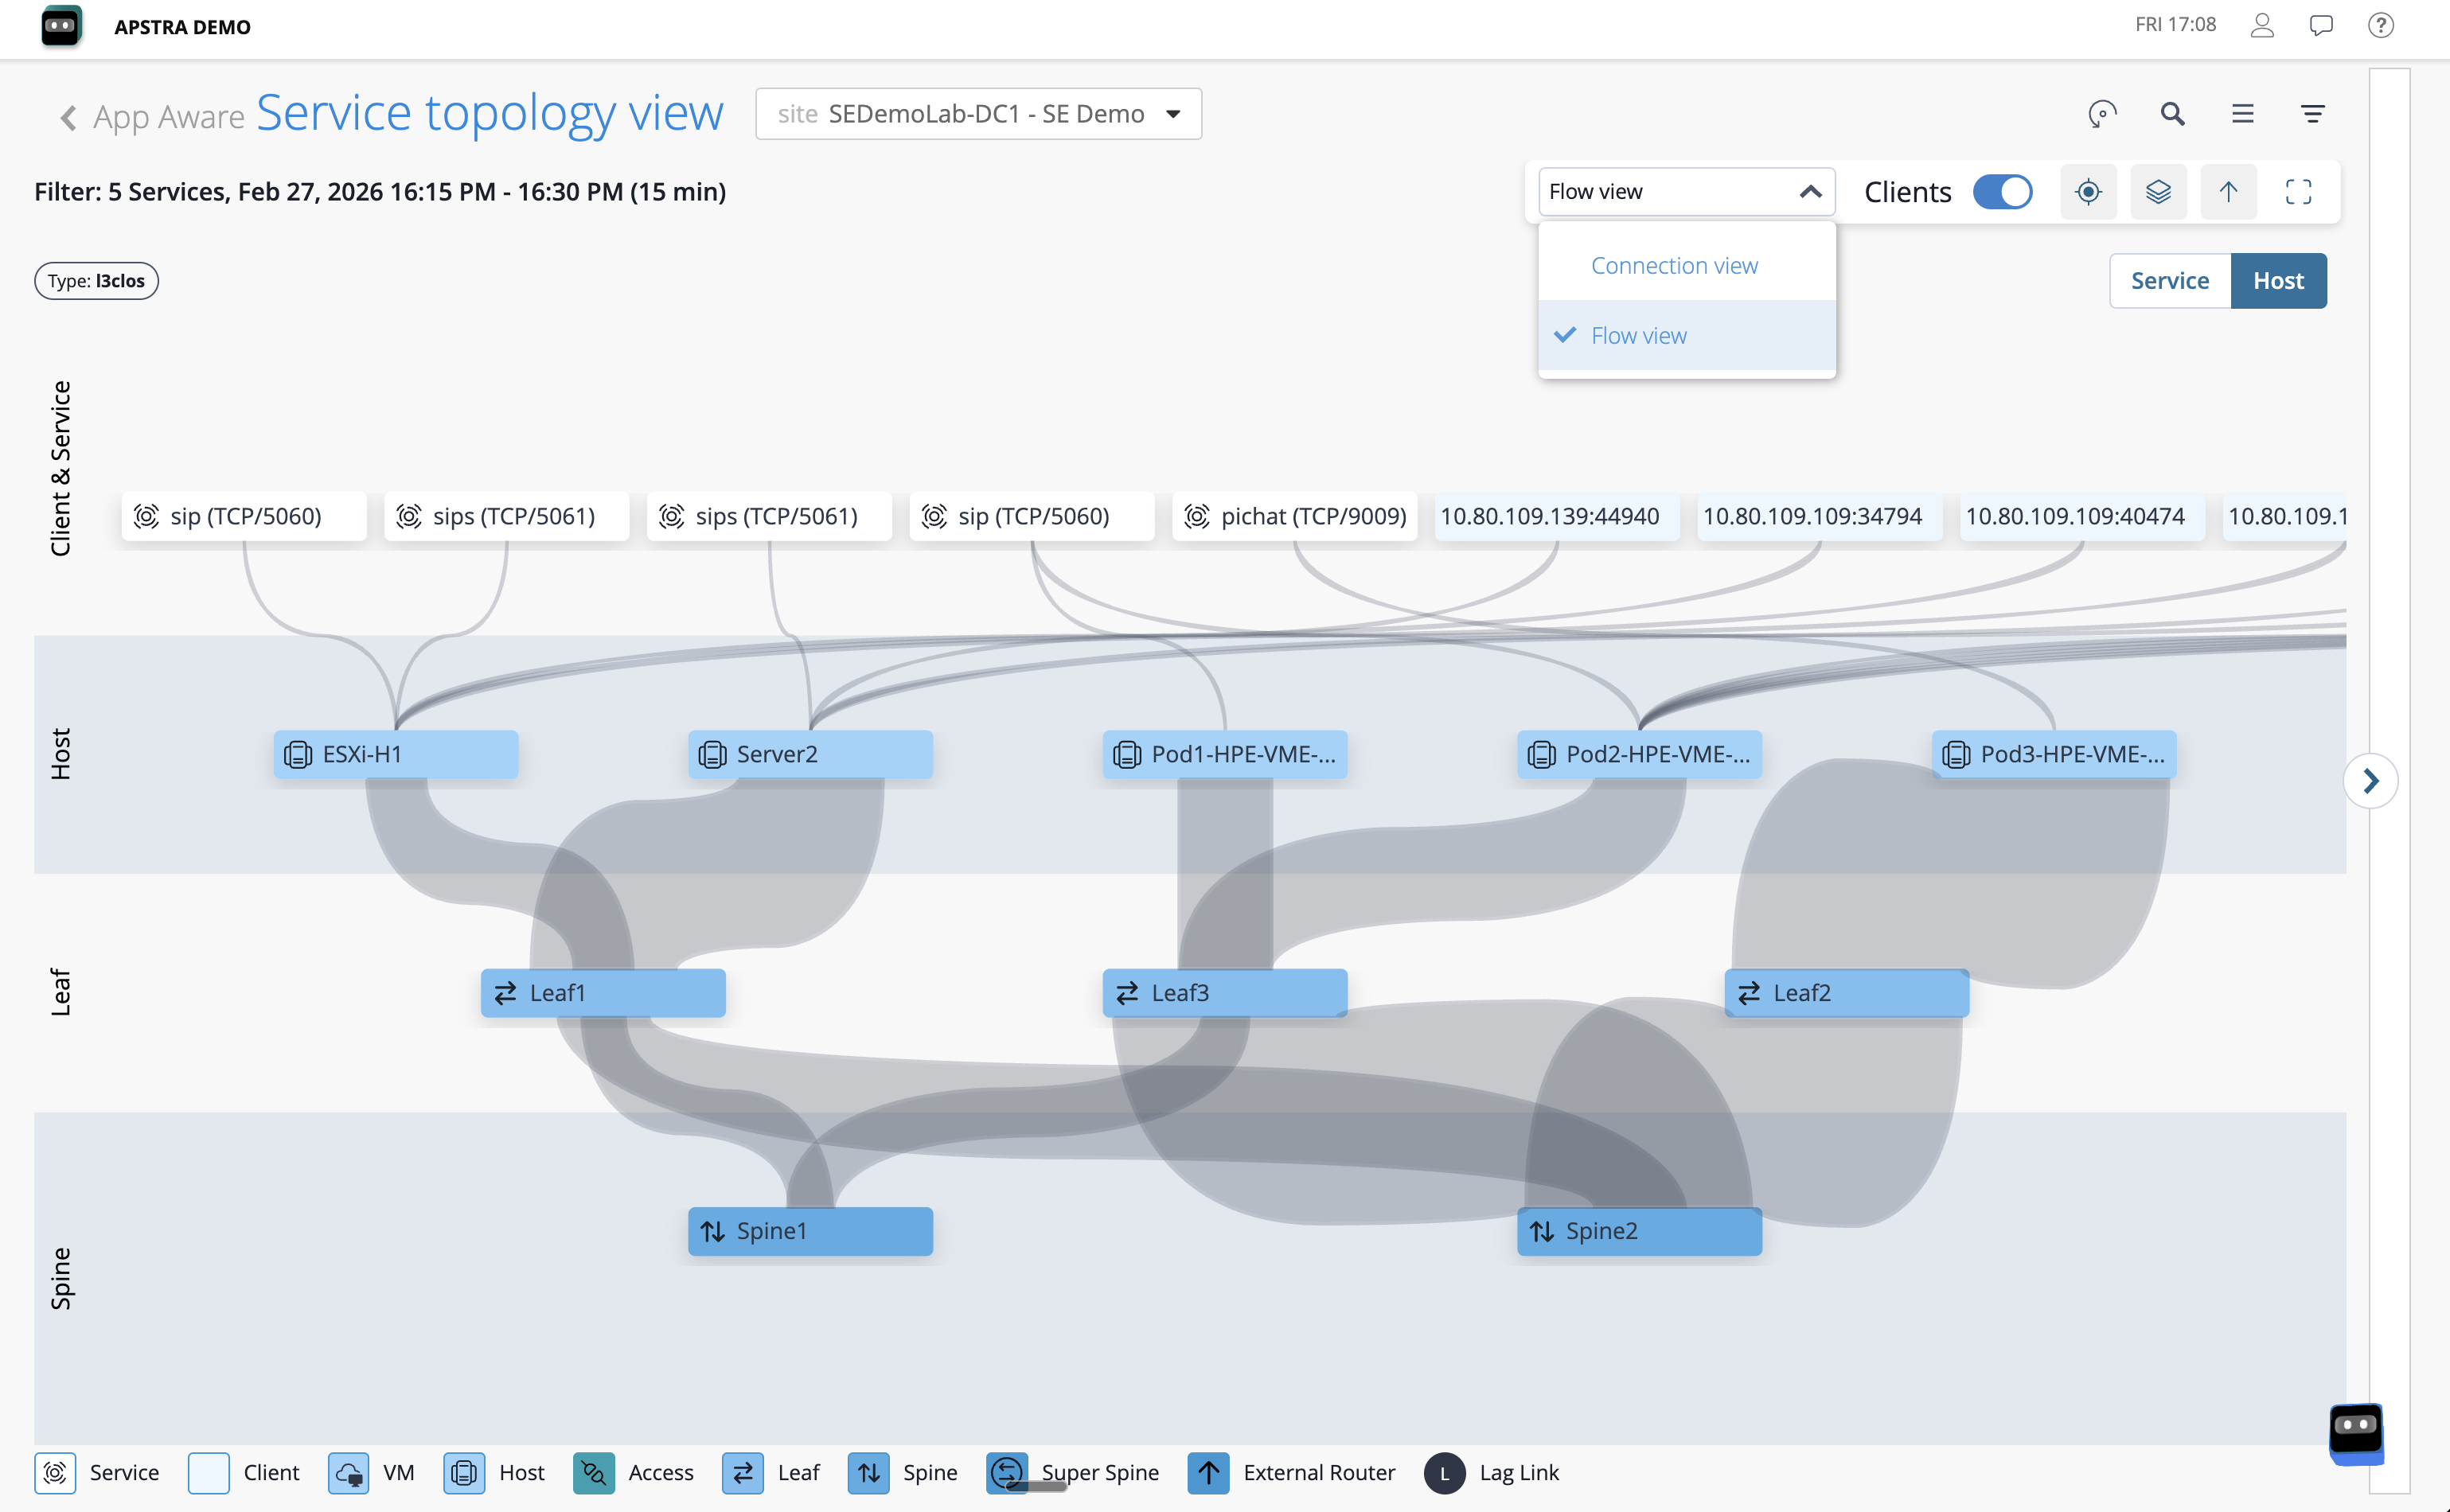
Click on any active flow in the list or on the topology overlay. The detail panel on the right will show the source and destination addresses, the protocol and volume of the traffic, and the precise path the flow took through the fabric — including device names, interface identifiers, and link utilisation at the time the flow was active.
|
Notice the device names and interface identifiers in the flow detail. These are attached automatically — DC Assurance did not look them up from a table. It knows them because Apstra Data Center Director’s graph model already contains the full relationship between every IP address, every interface, and every device in the fabric. The context is structural, not lookup-based. |
What you have just seen
Consider what this means for the investigation process you described earlier. The context that would typically take 30 minutes or more to assemble manually — providing you even have flow data. Seeing which path a flow took, which devices it passed through, this is available here instantly, for any flow, for any point in time that DC Assurance has data for.
Think about what that changes for your team.