Section 1: Accessing the demo environment
The DC Assurance demo environment is a live, cloud-hosted instance with real traffic running through it. You are not looking at static screenshots or simulated data — the environment generates and processes Flow data continuously, so what you see reflects genuine traffic patterns at the time you are viewing it.
Sign-up process
First, create an account on the DC Assurance platform at https://dc.ai.juniper.net/signin.html#!signup/register.
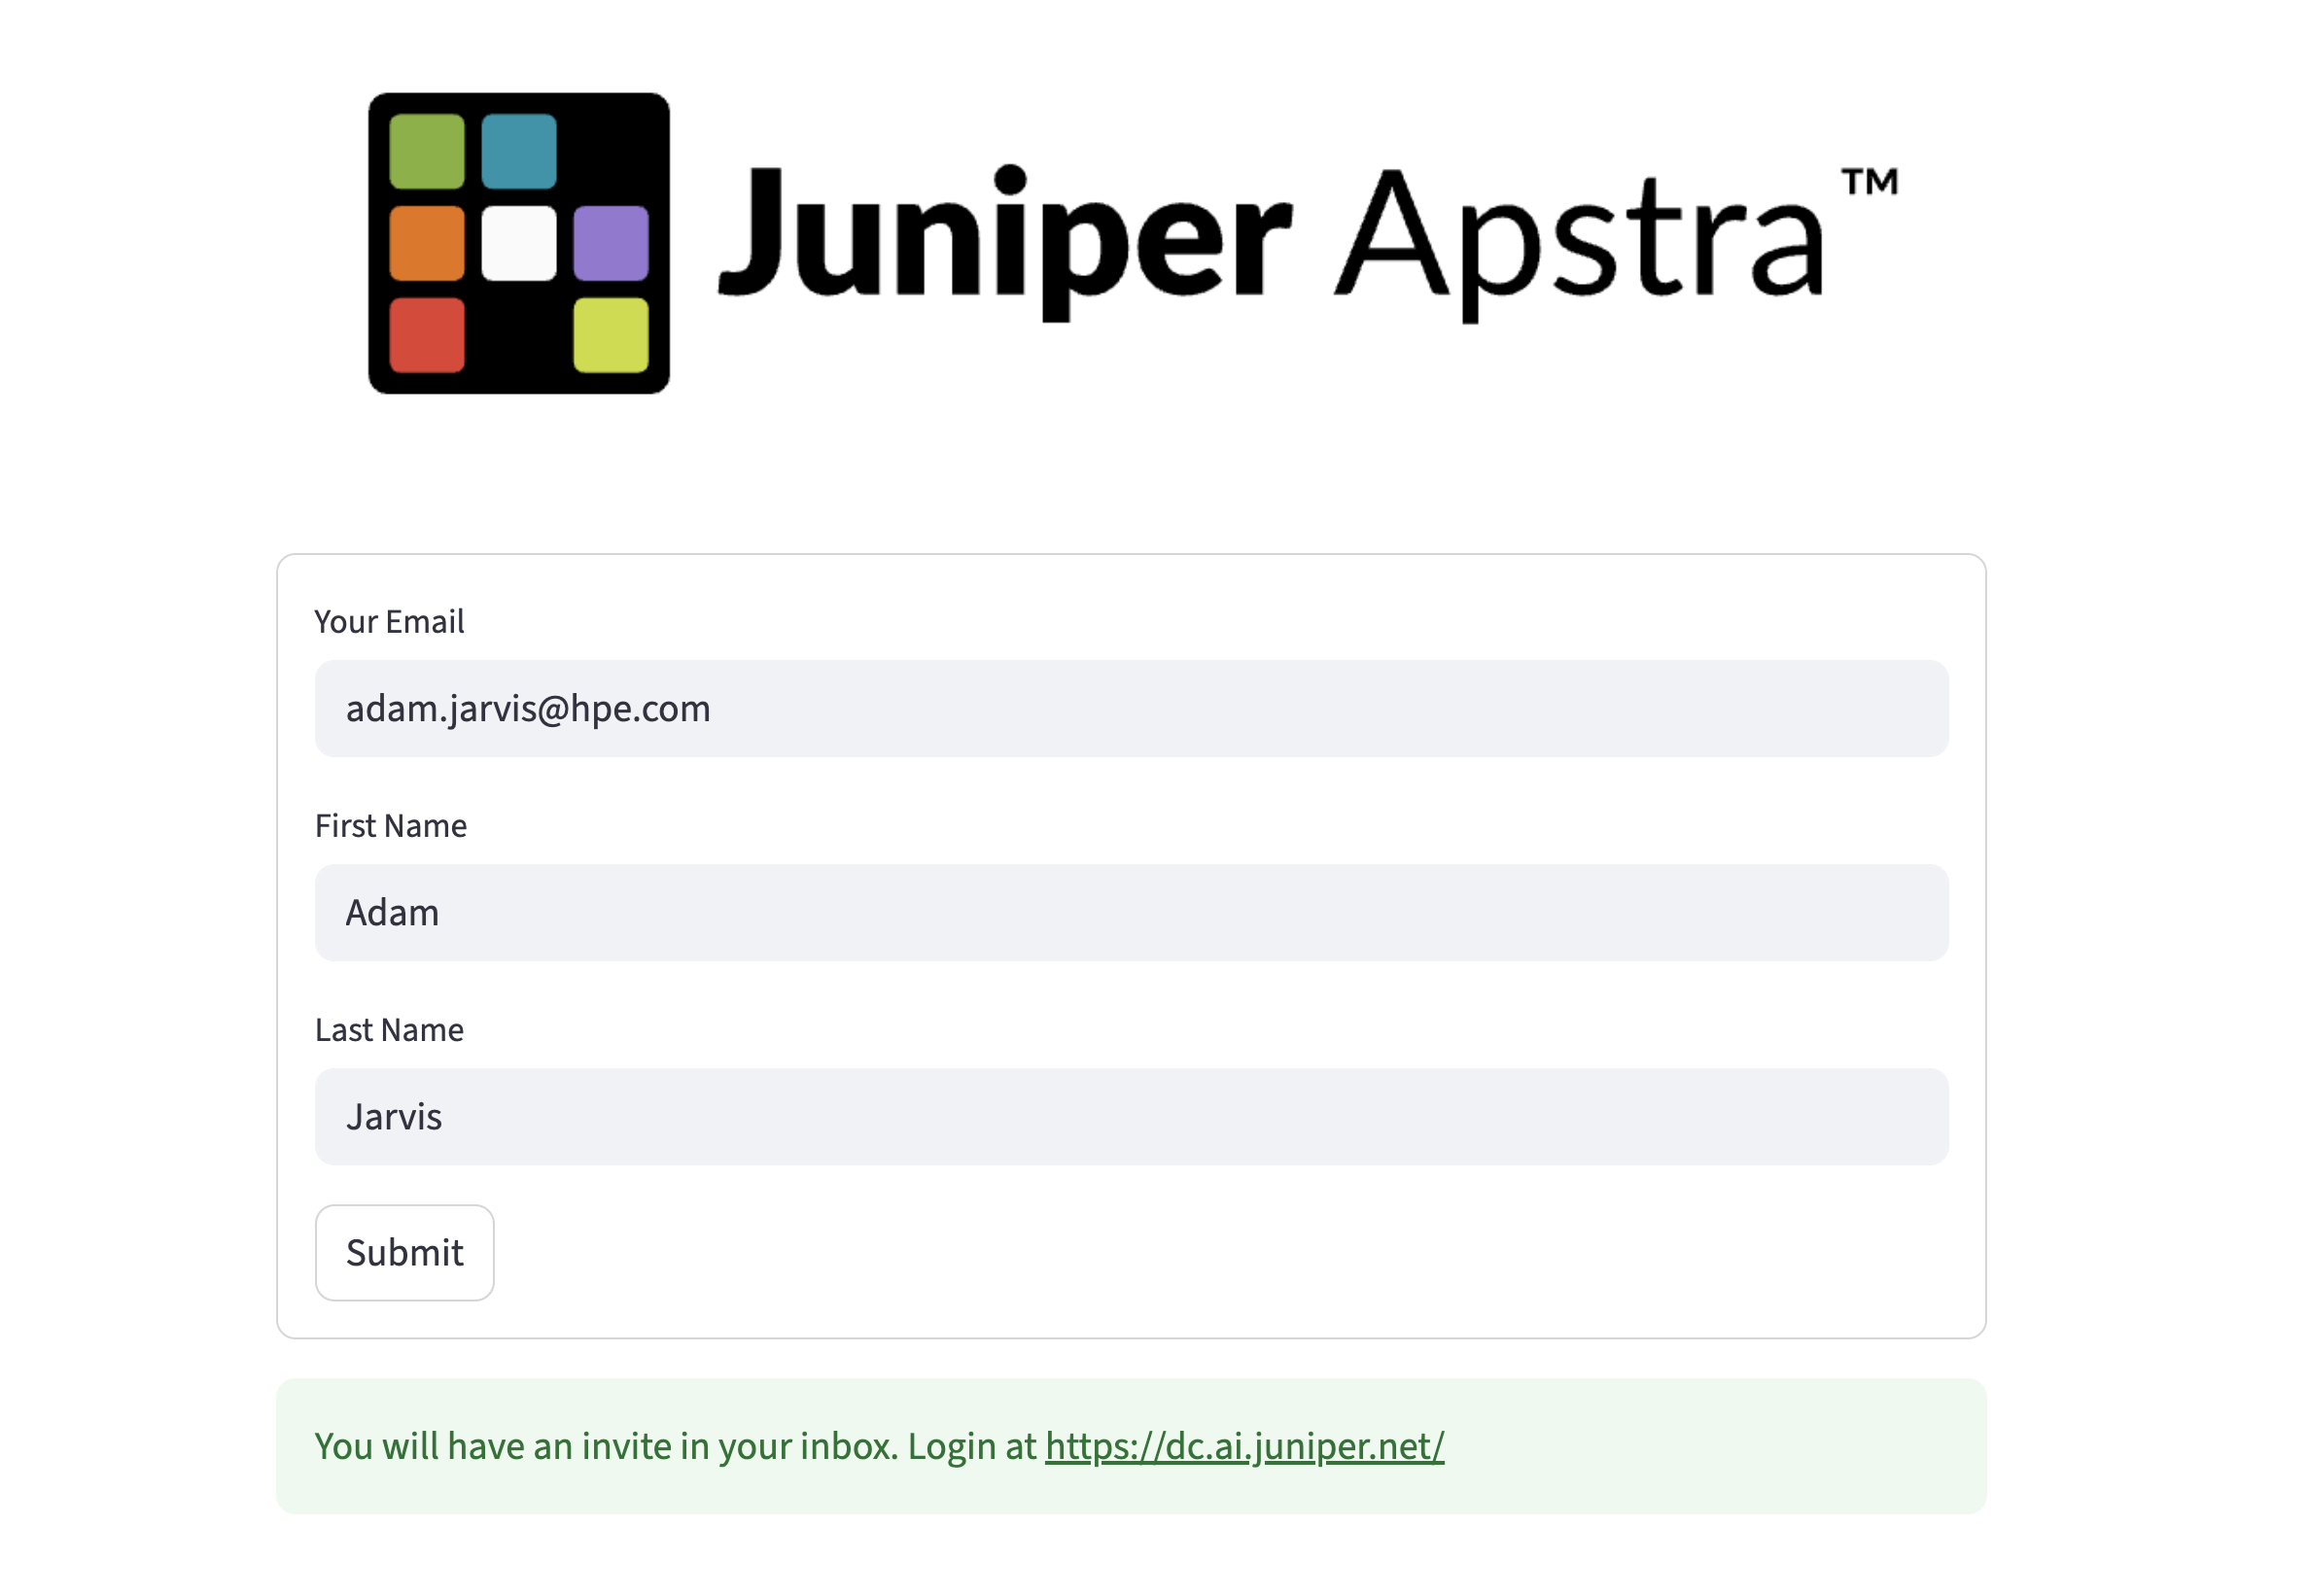
Once you have created an account, navigate to the demo access form at https://get-dca.osiodyssey.com/ and fill in your details. Once submitted, you will receive an invitation to the environment.
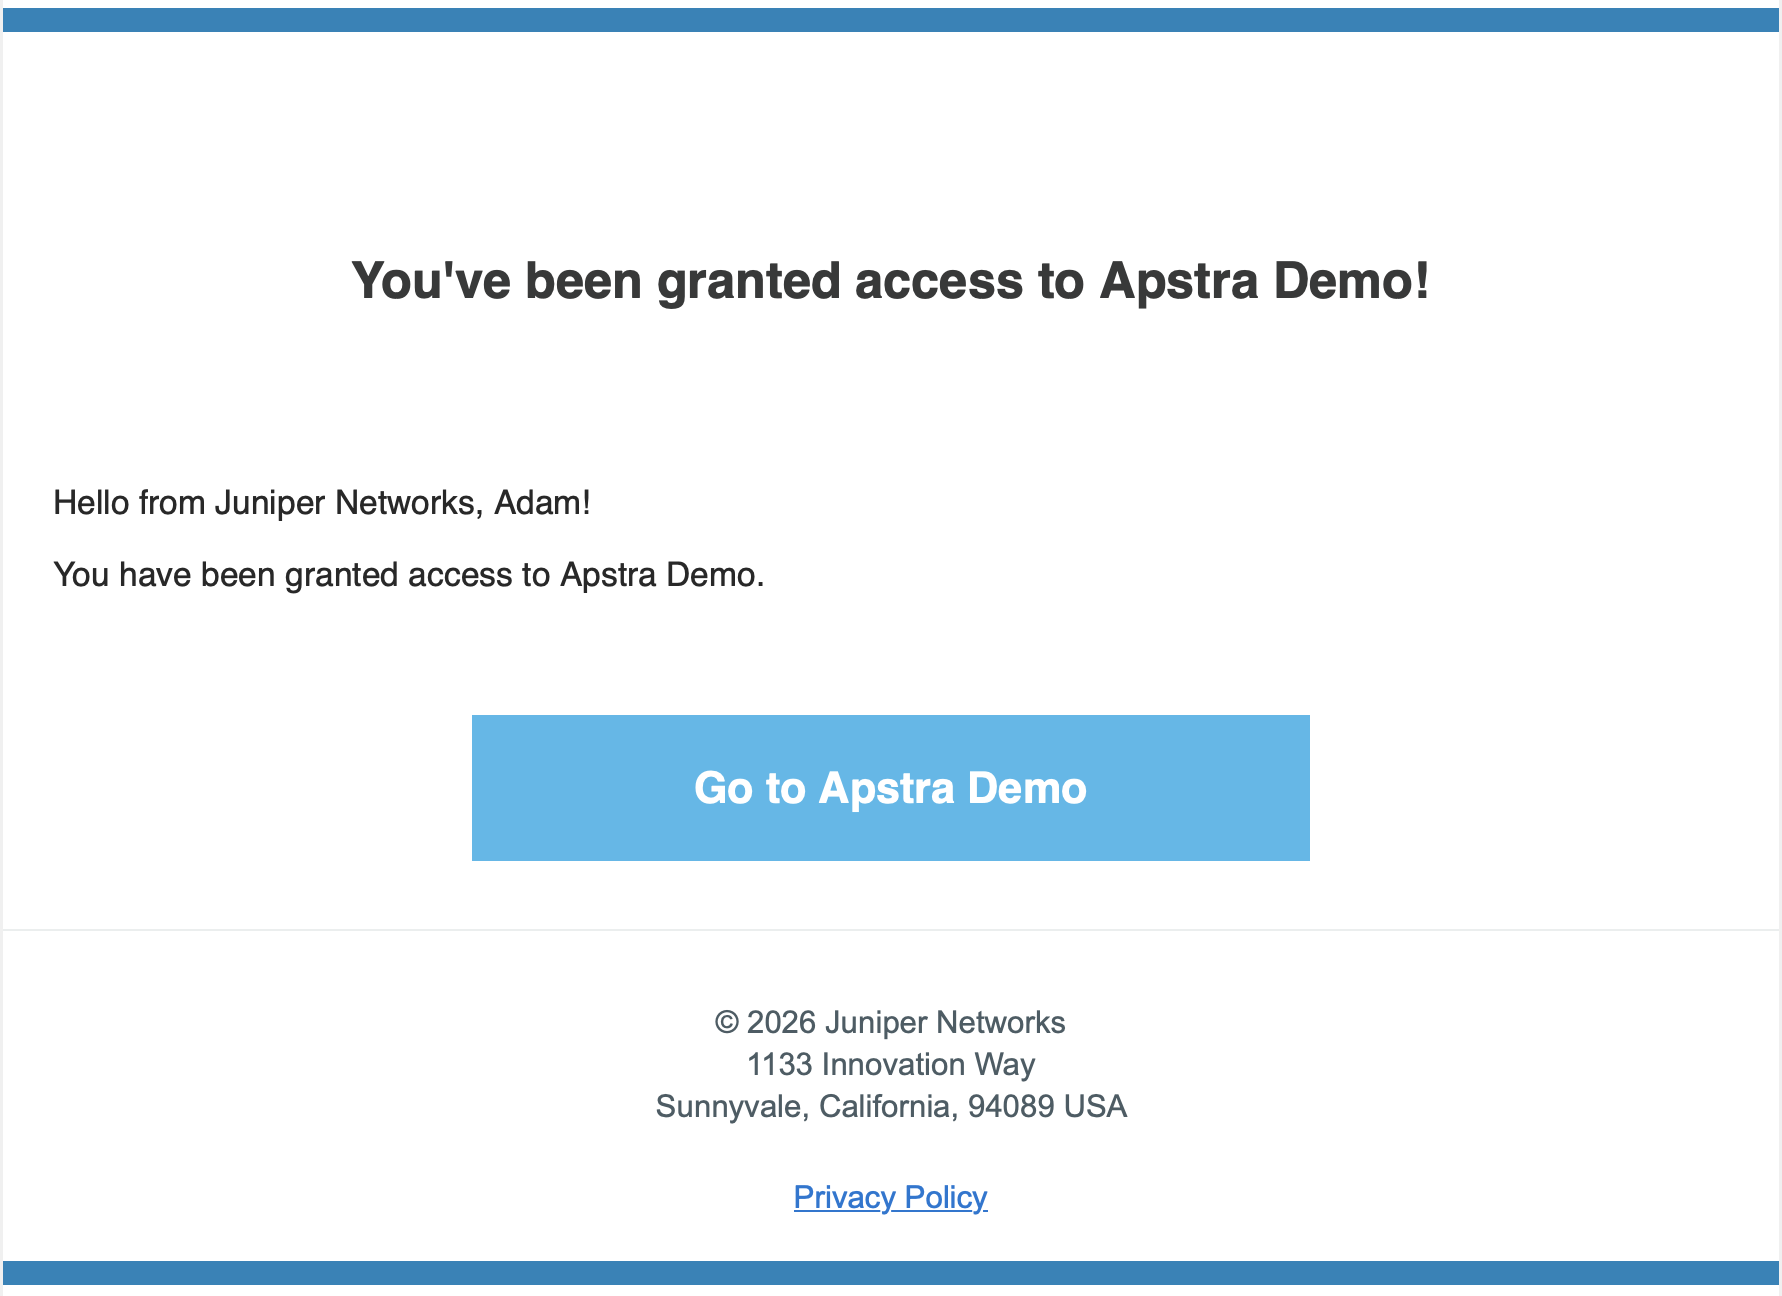
Your invitation will arrive by email from no-reply@mailservices.juniper.net.
|
The sign-up form asks for a work email address and your name. This information is used to provision your access — it is not used for marketing purposes |
Logging in
Once you accept your invite to the demo organisation, navigate to the DC Assurance dashboard. Enter your credentials and click Sign in.

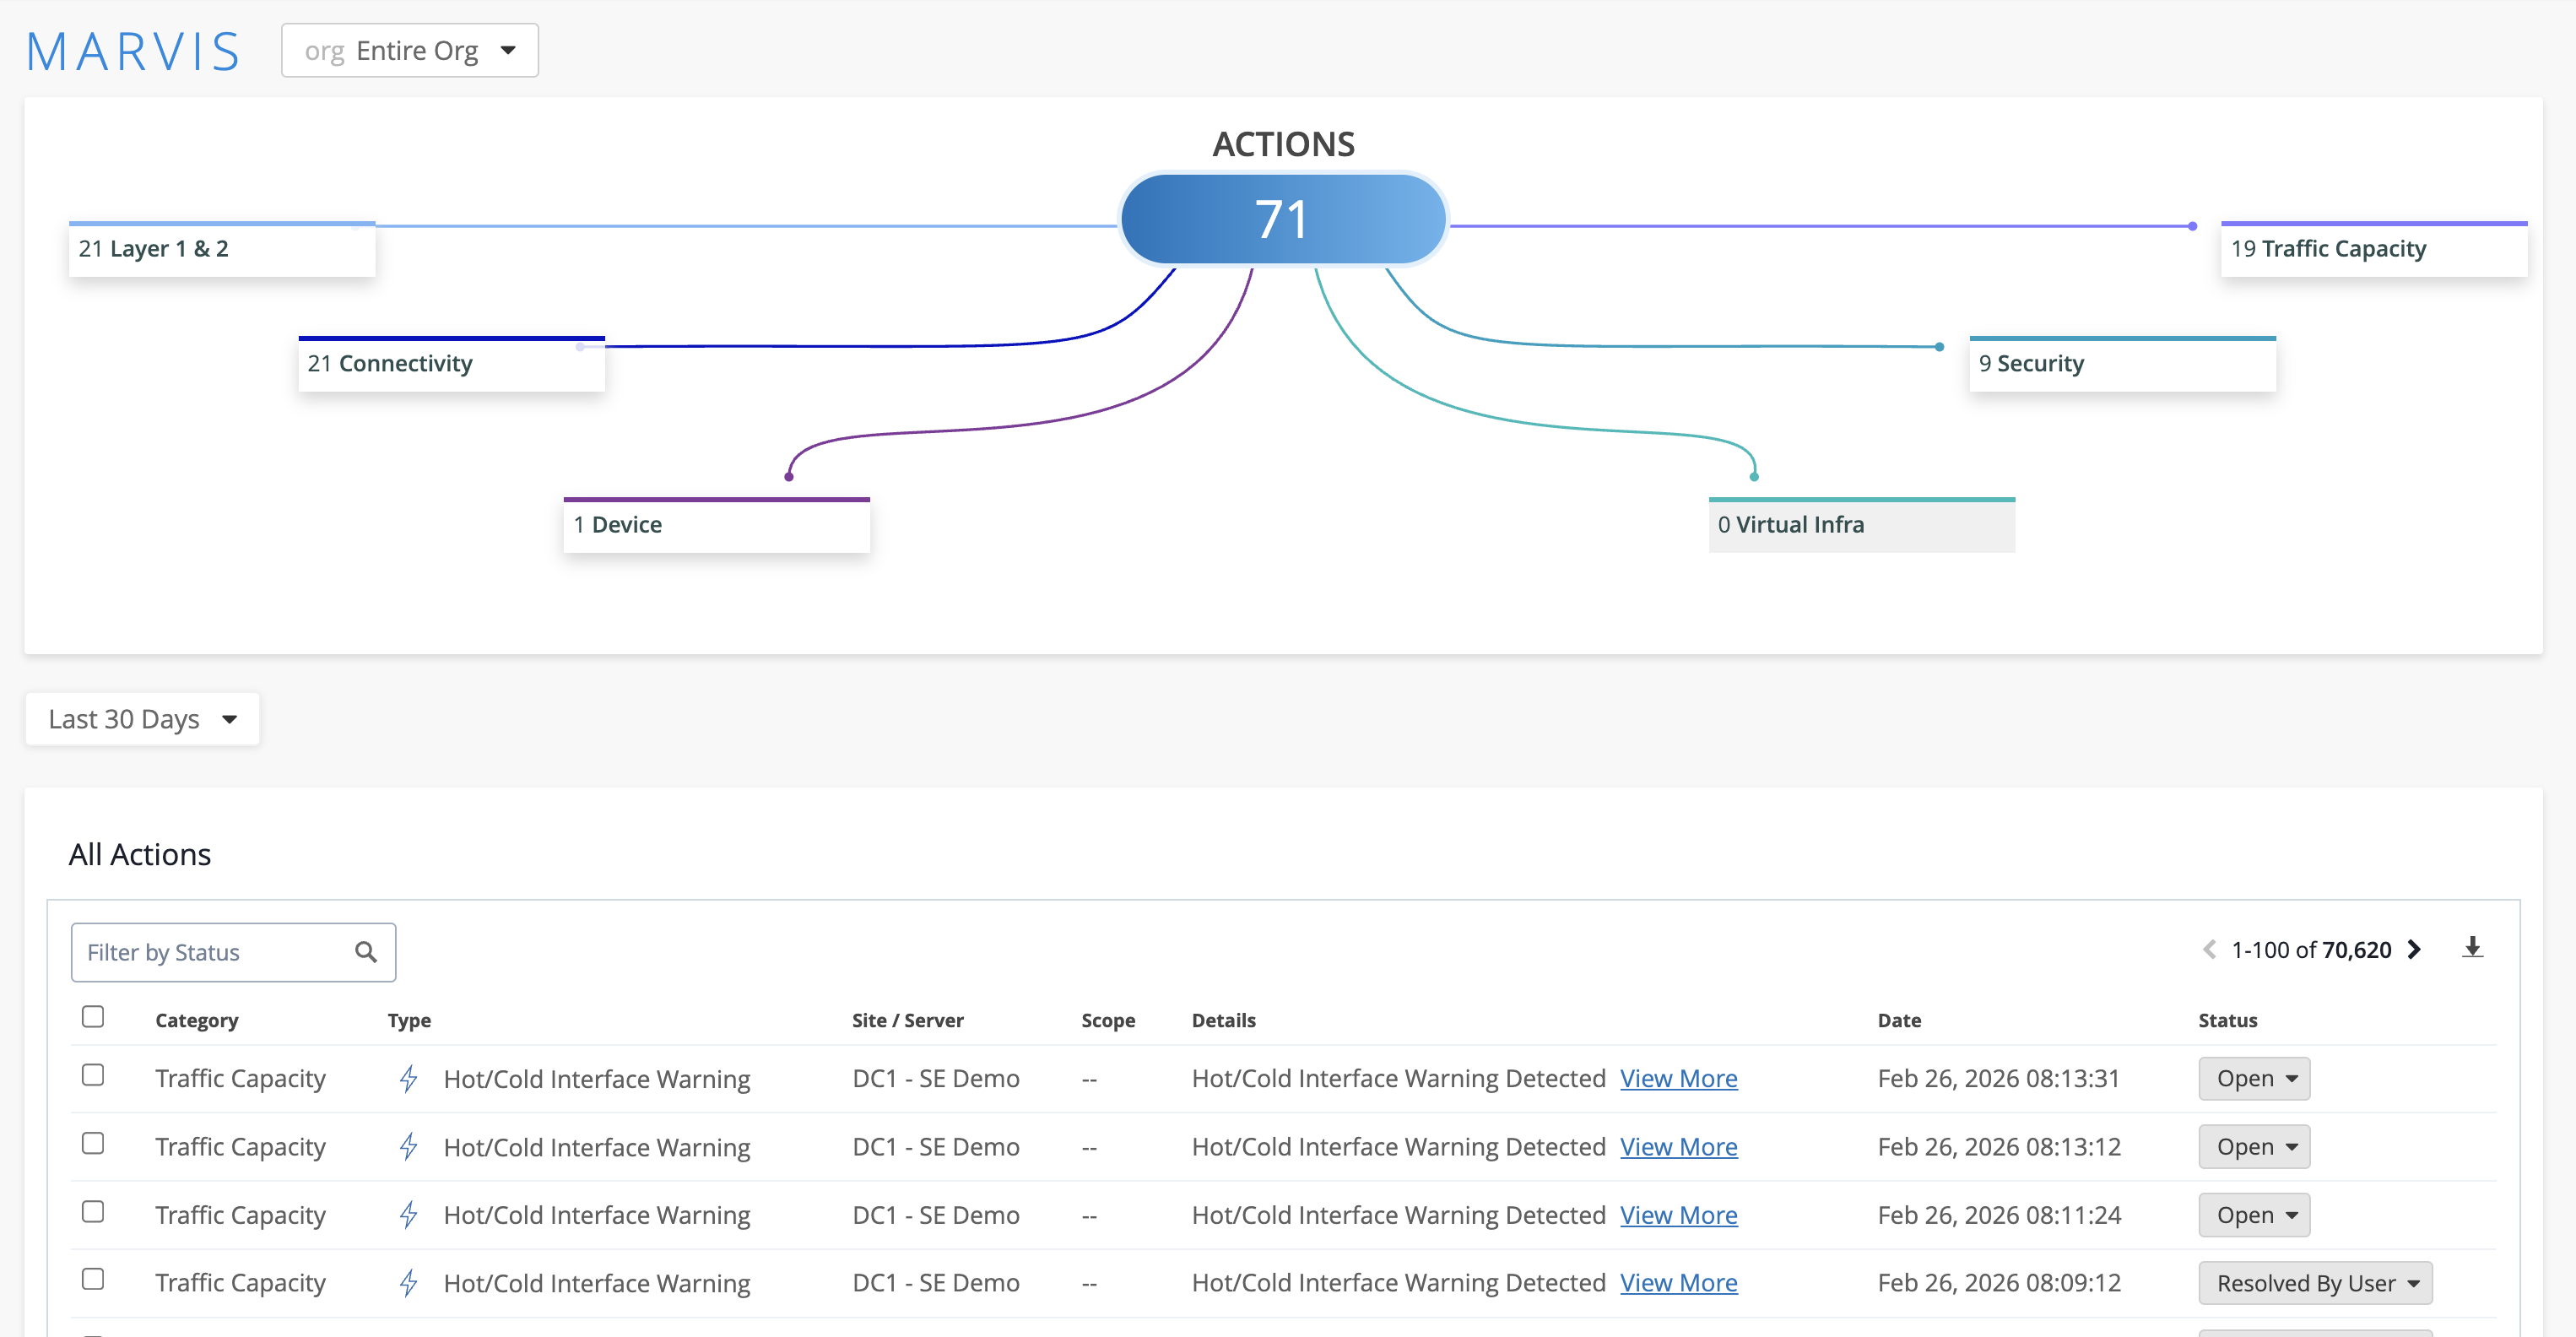
Select the demo organisation from the list and you will land on the Marvis Actions page.
What you are looking at
The Marvis Actions page gives you a cross-site view of network health. It shows you the anomlaies that DC Assurance has detected across all connected sites, and allows you to see reocmended actions for each one. Giving a quick overview of the health of your network, it is the starting point for DC Assurance’s insights.
|
Think about how you and your team currently get a view like this. DC Assurance brings it into one place, across every connected site, updated in real time. |
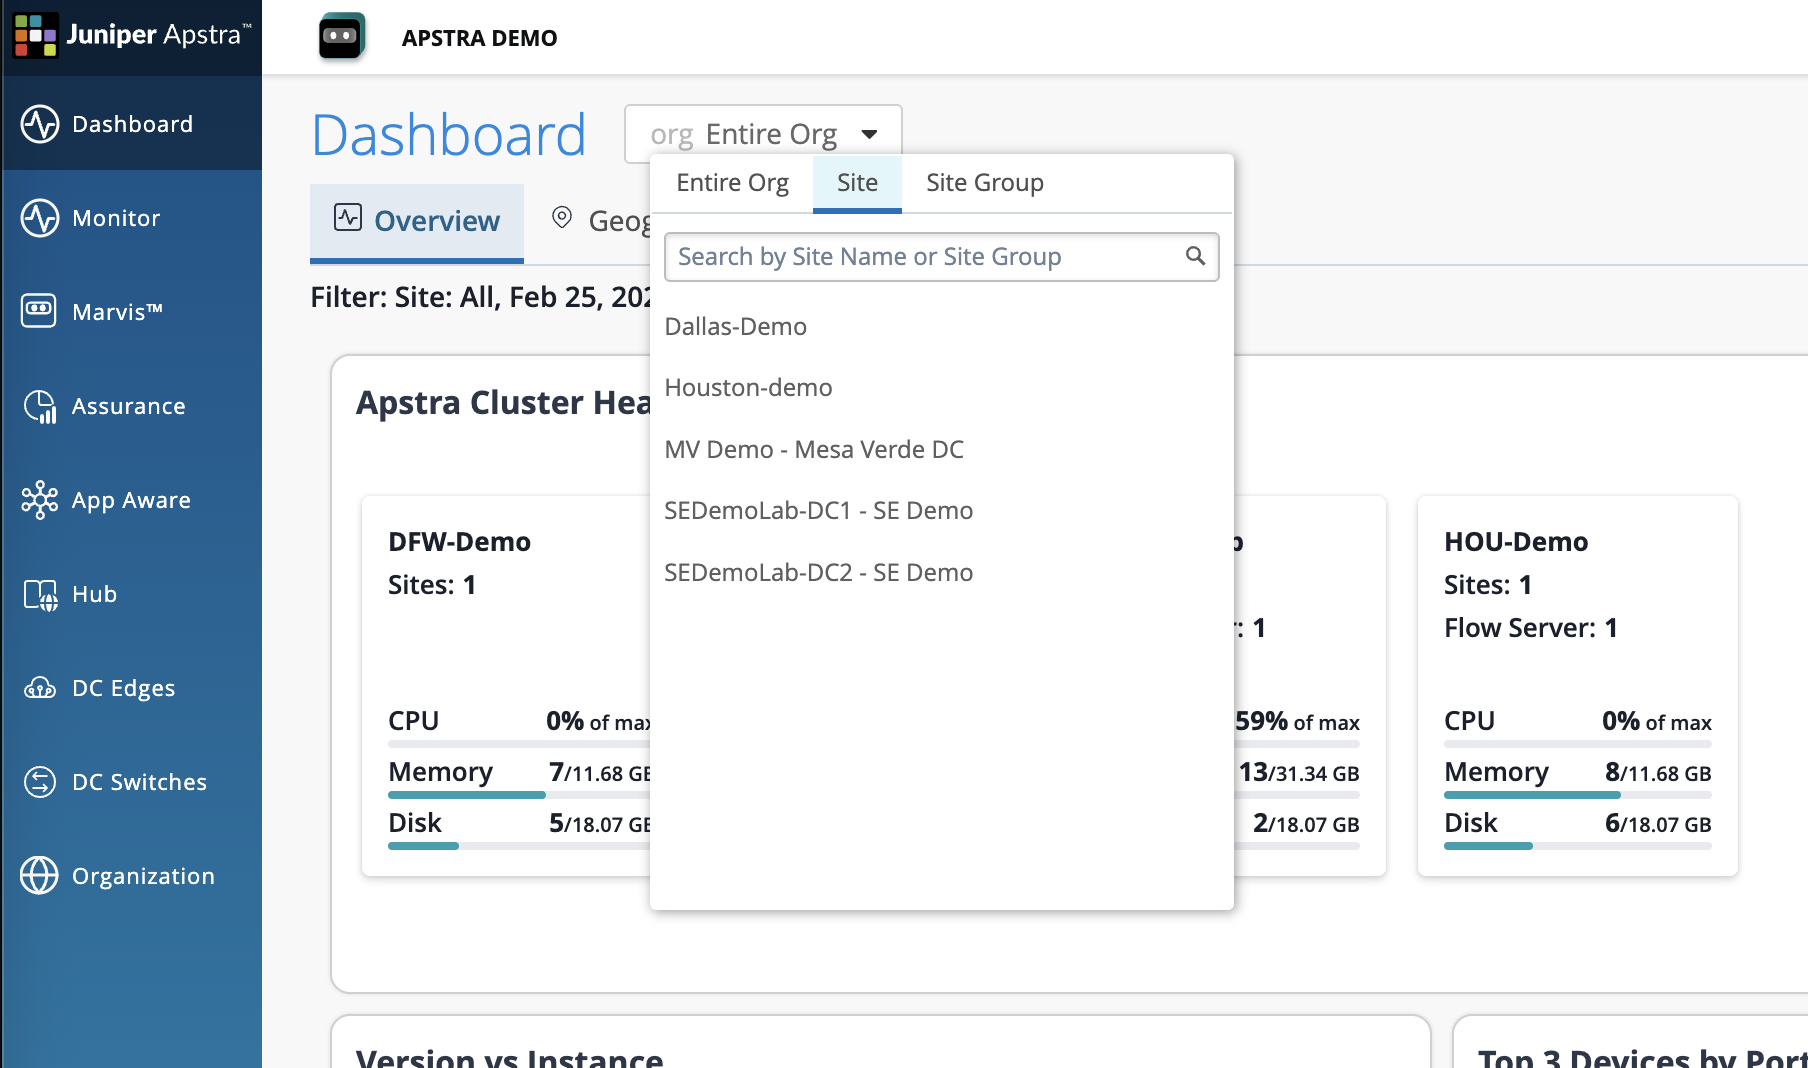
Navigating to the lab blueprints
The demo environment contains two blueprints, both with live traffic generating Flow data:
-
SEDemoLab-DC1 – SE Demo
-
SEDemoLab-DC2 – SE Demo
To navigate to them, click DC Assurance in the topnavigation menu. Both sites will be listed. For the exercises in this guide, you will primarily work with SEDemoLab-DC1.
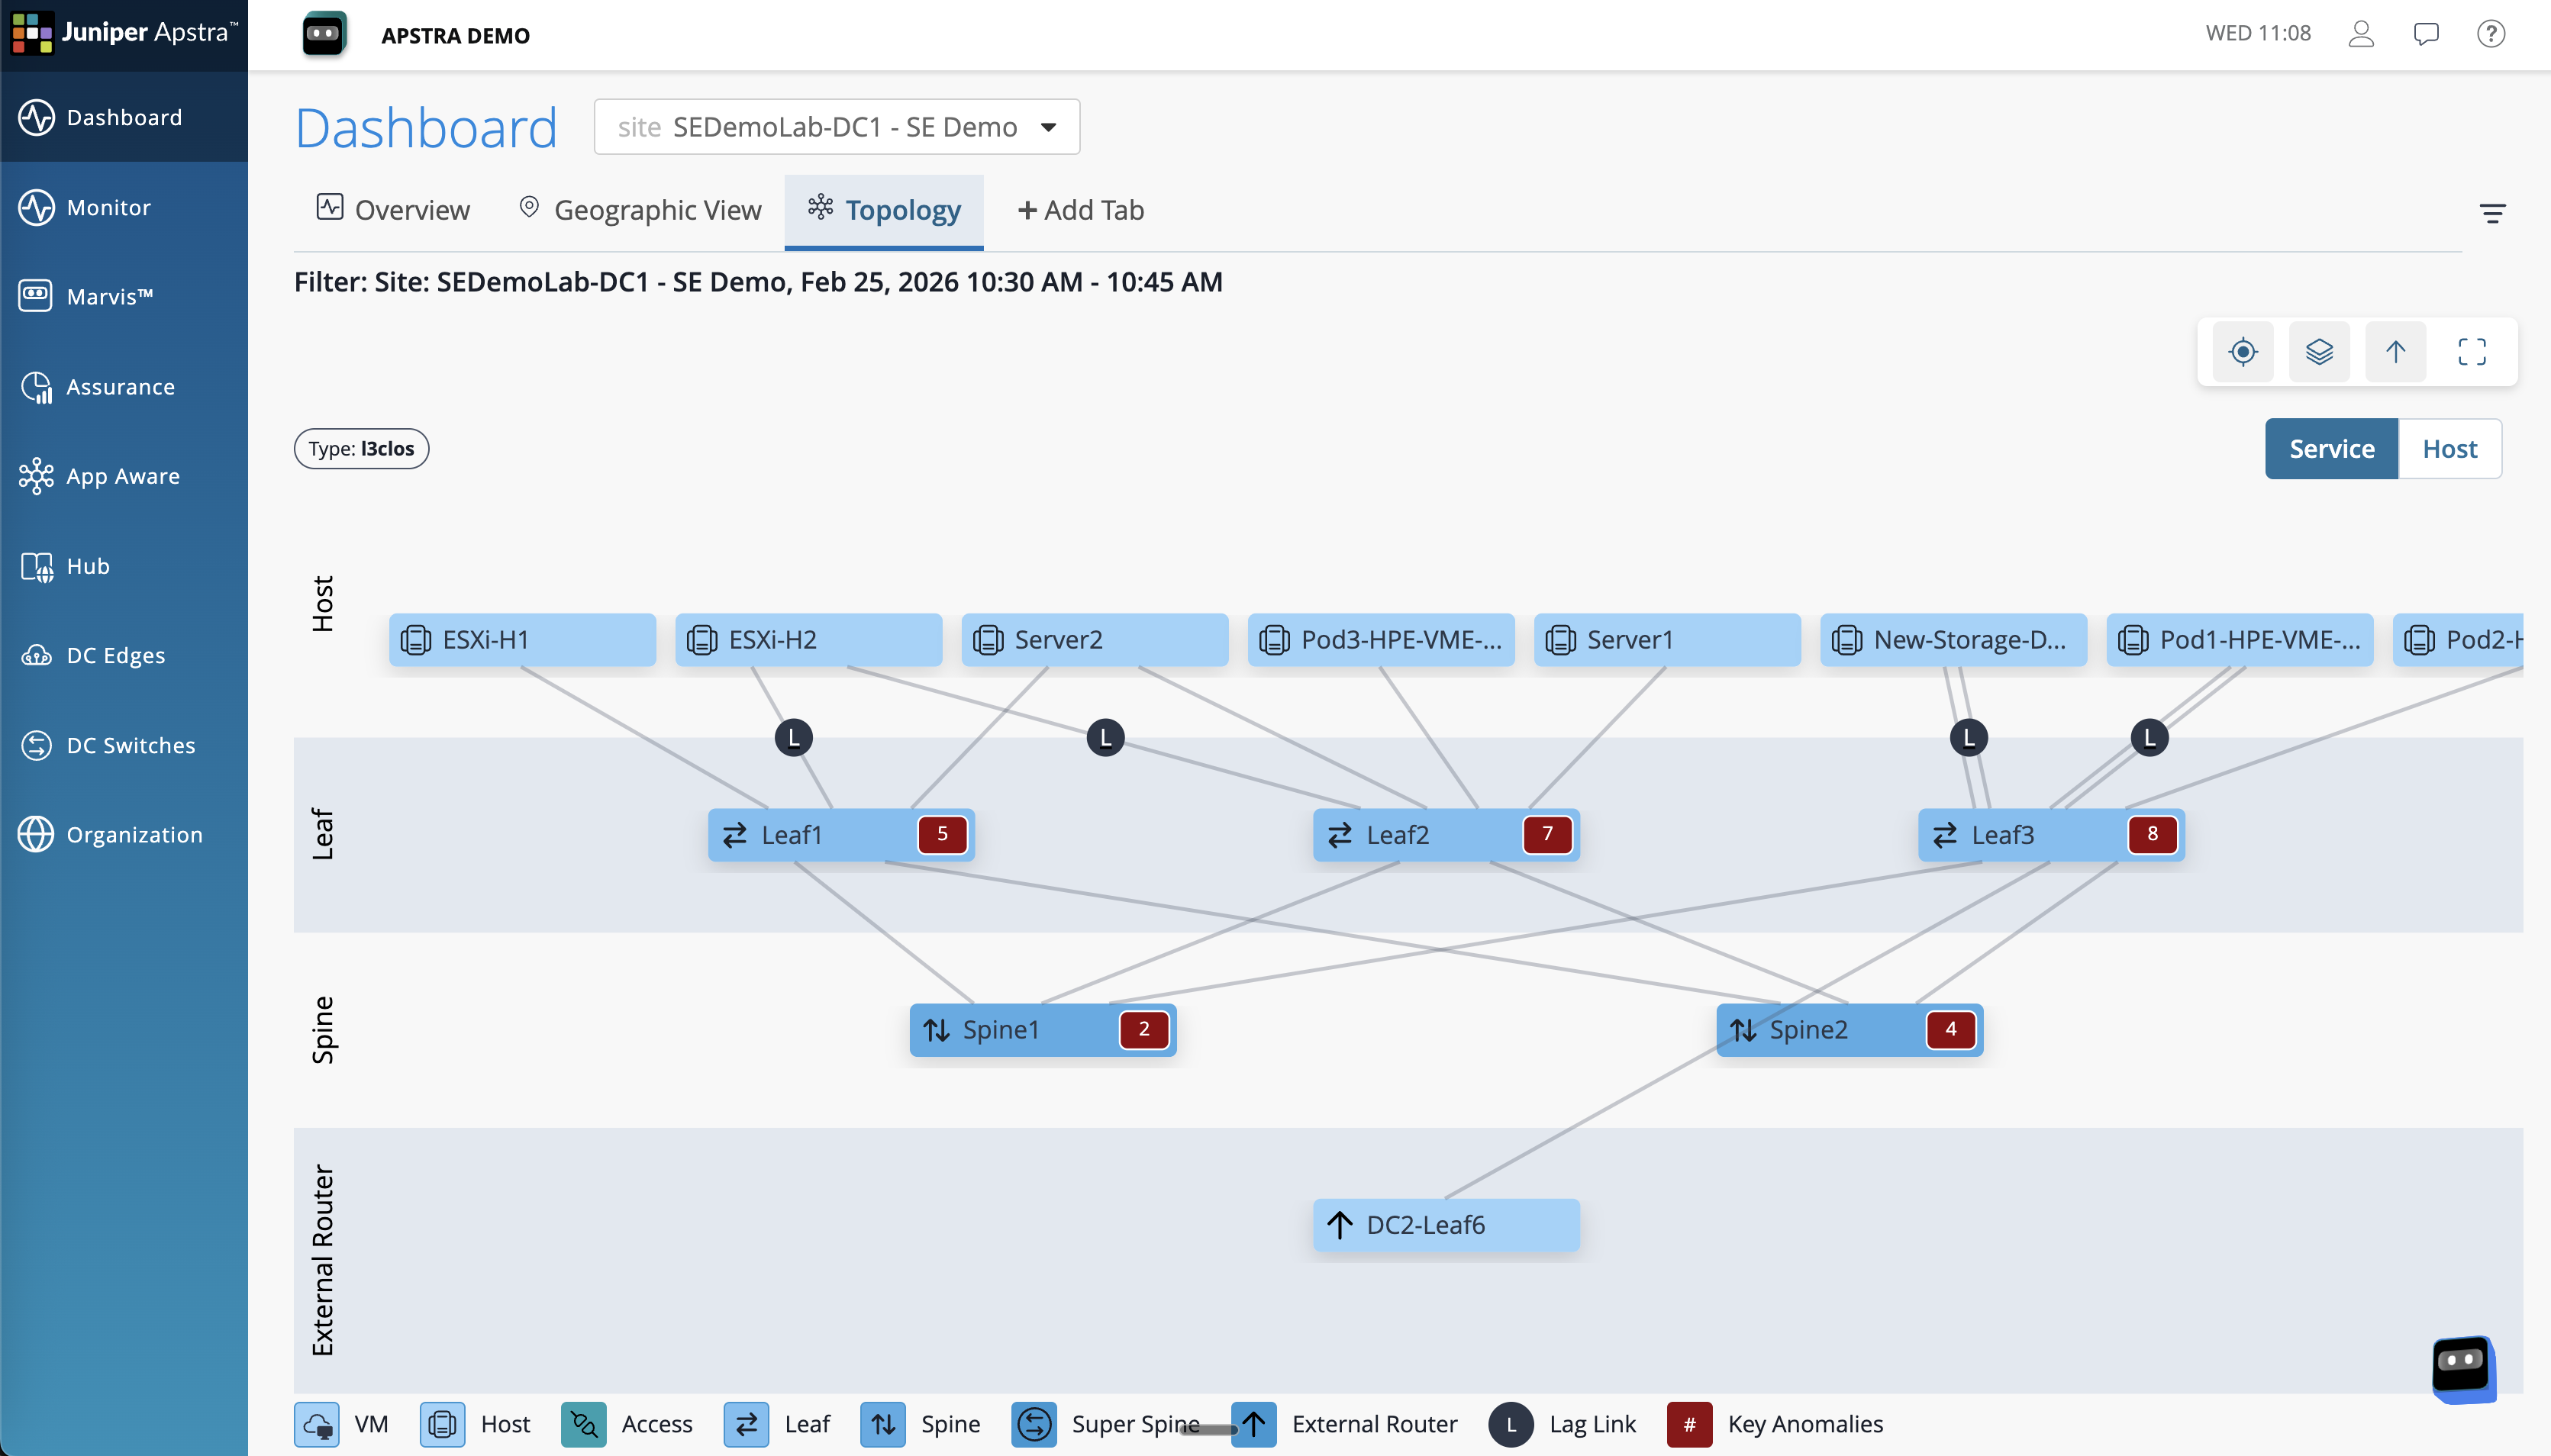
Each blueprint represents a unique site — two separate simulated data centre fabrics, each with its own devices, links, and traffic patterns. In a real deployment, each blueprint would correspond to a physical data centre, with DC Assurance pulling Flow data from each independently.
|
You may notice that the health scores for DC1 and DC2 differ. This is intentional — the demo environment is configured to show a range of conditions, giving you material to explore across all three scenarios. DC2 is available if you want to see how multi-site comparisons work in practice. |
Familiarising yourself with the interface
The left-hand menu is your primary navigation tool throughout this guide. The key areas you will use are:
-
Dashboard — the main analytics dashboard, showing health scores and issues across all connected sites
-
Assurance — the corelation of anomalies on the network, the user impact, and root cause identification
-
App Aware - application monitoring and visibility against your DC network
-
Monitor >> Marvis — where you view SLE scores, Flow data, and anomaly detail for a specific blueprint
-
Settings — platform configuration, covered in the reference section
When drilling into a specific site you are narrowing your scope and drilling deeper into the data within DC Assurance.
Take a moment to scan the screen. You do not need to understand every element at this stage — you will return to each of these areas in detail as you work through the three scenarios.