Demo 1: Service Level Expectations
This is the first of three scenarios and the most foundational. Everything that follows builds on what you see here. Before navigating to the Monitor screen, it is worth taking a moment to understand the conceptual distinction between a Service Level Agreement and a Service Level Experience. Without this context, the SLE scores can look like just another set of percentages.
SLA vs SLE: the distinction that changes what you look for
A Service Level Agreement asks: "Is the network up?" It is binary. The network is either available or it is not, and the SLA score reflects the percentage of time the network was available in a given period.
A Service Level Experience asks: "Is the network performing as the people using it would expect?" It is a measure of quality from the user’s point of view, not a measure of availability from the infrastructure’s point of view.
The distinction is not just semantic. A network can be 100% available and still be delivering a poor experience — because links are congested, because routing is suboptimal, because interface errors are causing retransmissions that users notice as latency or packet loss. An SLA would report everything as fine. An SLE would not.
Think about how you currently measure whether your network is delivering a good experience — not just whether it is up. That is the question the SLE view is designed to answer.
When your network has a problem, who is typically the first person to know? Is it your operations team, or is it a user calling to complain? In most environments, users notice performance degradation before the operations team does — because the operations team is looking at availability and thresholds, while users are experiencing the actual quality of the service. DC Assurance’s SLE framework inverts this.
Starting with the multi-site SLEs
Before drilling into DC1, return to the top-level DC Assurance dashboard by clicking DC Assurance in the left-hand navigation.
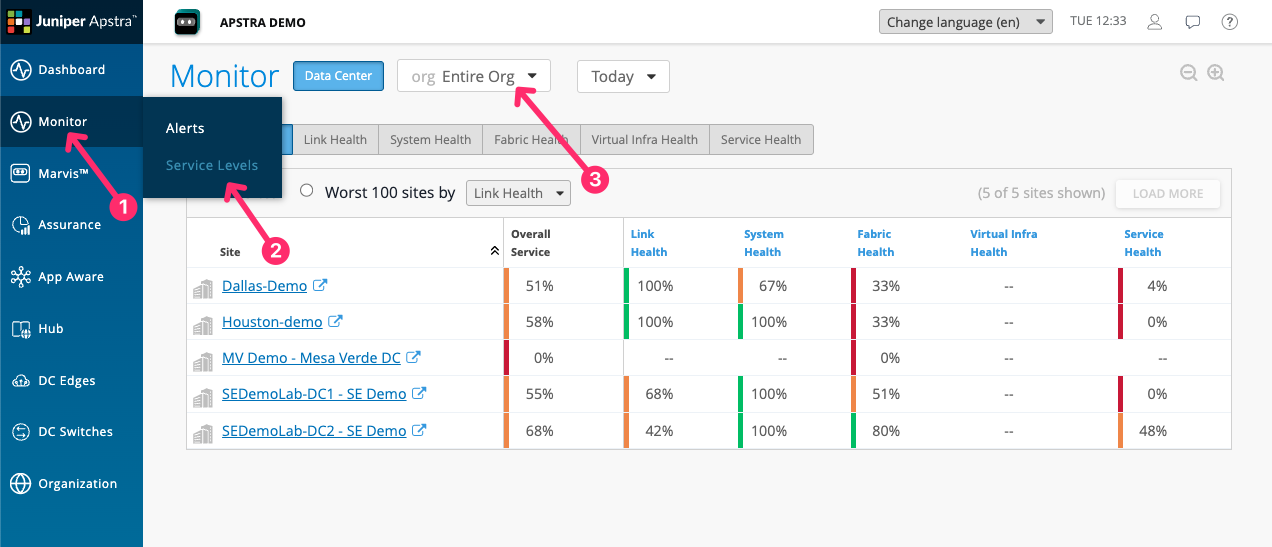
Both sites are showing SLE scores, and those scores differ. If you manage multiple data centres, this is the view your team would use as their starting point. Which of these sites would you investigate first, and what does that tell you about how you currently prioritise your team’s attention?
The five SLEs
Click on SEDemoLab-DC1 – SE Demo from the list To bring up all of the SLEs relevant to this one site.
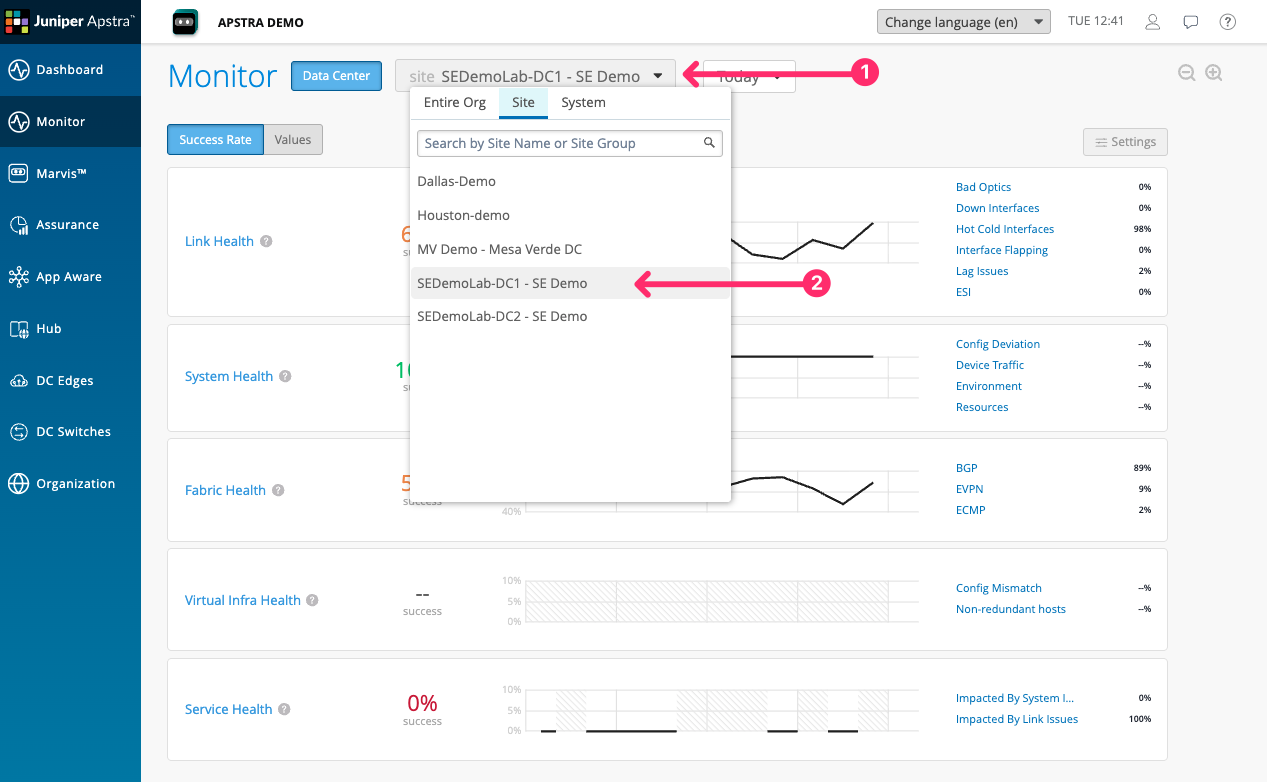
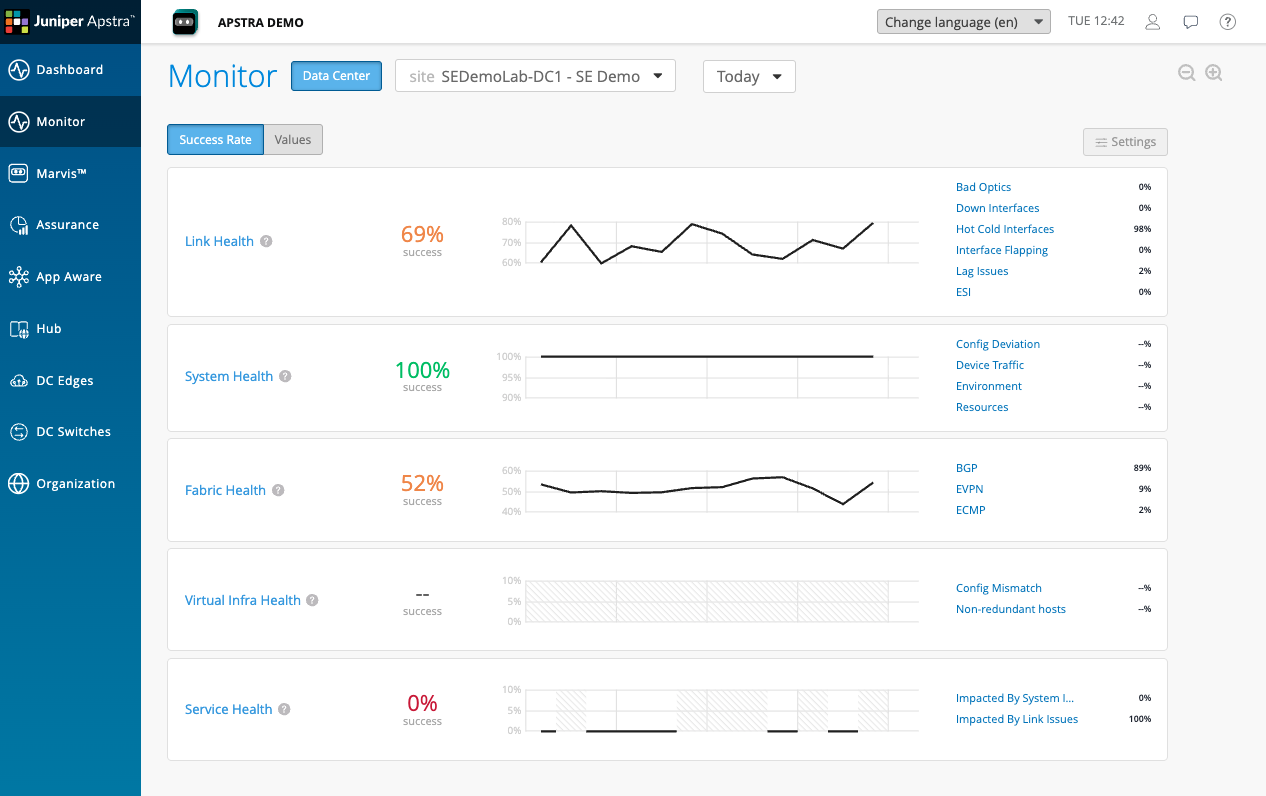
You are now looking at the five SLEs for DC1. Each is expressed as a percentage with a colour status indicator.
| SLE | What it measures | Classifiers |
|---|---|---|
Link Health |
The quality of physical links in the fabric |
Down Interfaces, Hot Cold Interfaces, Interface Flapping, LAG Issues, Duplex Mismatch |
System Health |
The health of individual devices |
Config Deviation, Device Traffic, Environment, Resources |
Fabric Health |
Control-plane and overlay health |
BGP, EVPN, ECMP |
Virtual Infra Health* |
Alignment between virtual infrastructure and the fabric |
Config Mismatch, Non-redundant Hosts |
Service Health |
End-to-end service experience for users and applications |
Impacted by Link Issues, Impacted by System Issues |
Each SLE aggregates the classifiers beneath it. If Service Health is low, it means one or more classifiers — Impacted by Link Issues or Impacted by System Issues — is contributing to degradation. Clicking through to the classifier level shows you exactly which condition is driving the score and which devices or links are responsible.
|
*Virtual Infra Health requires data from the virtualisation layer — The vCenter connector needs to be configured in DC Assurance to see virtual host information. |
Looking at these scores, which one concerns you most?
Drilling into Service Health
Click on Service Health in the SLE list.
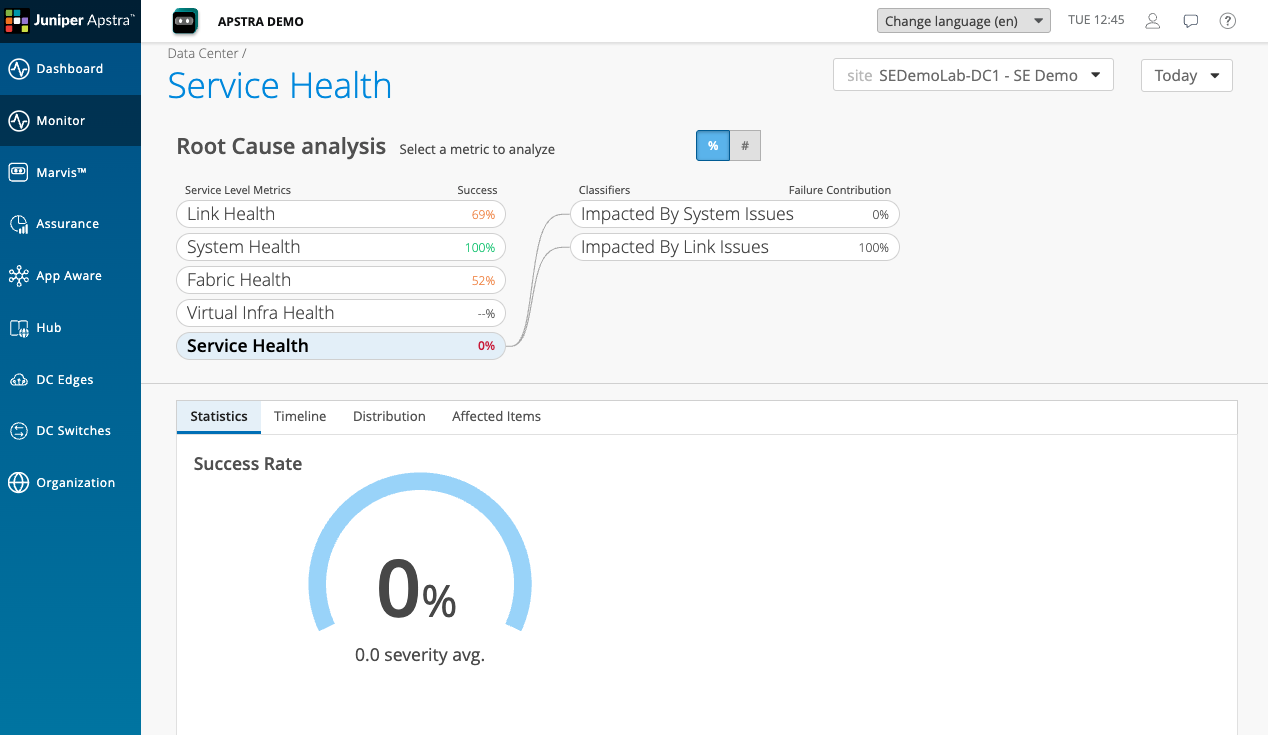
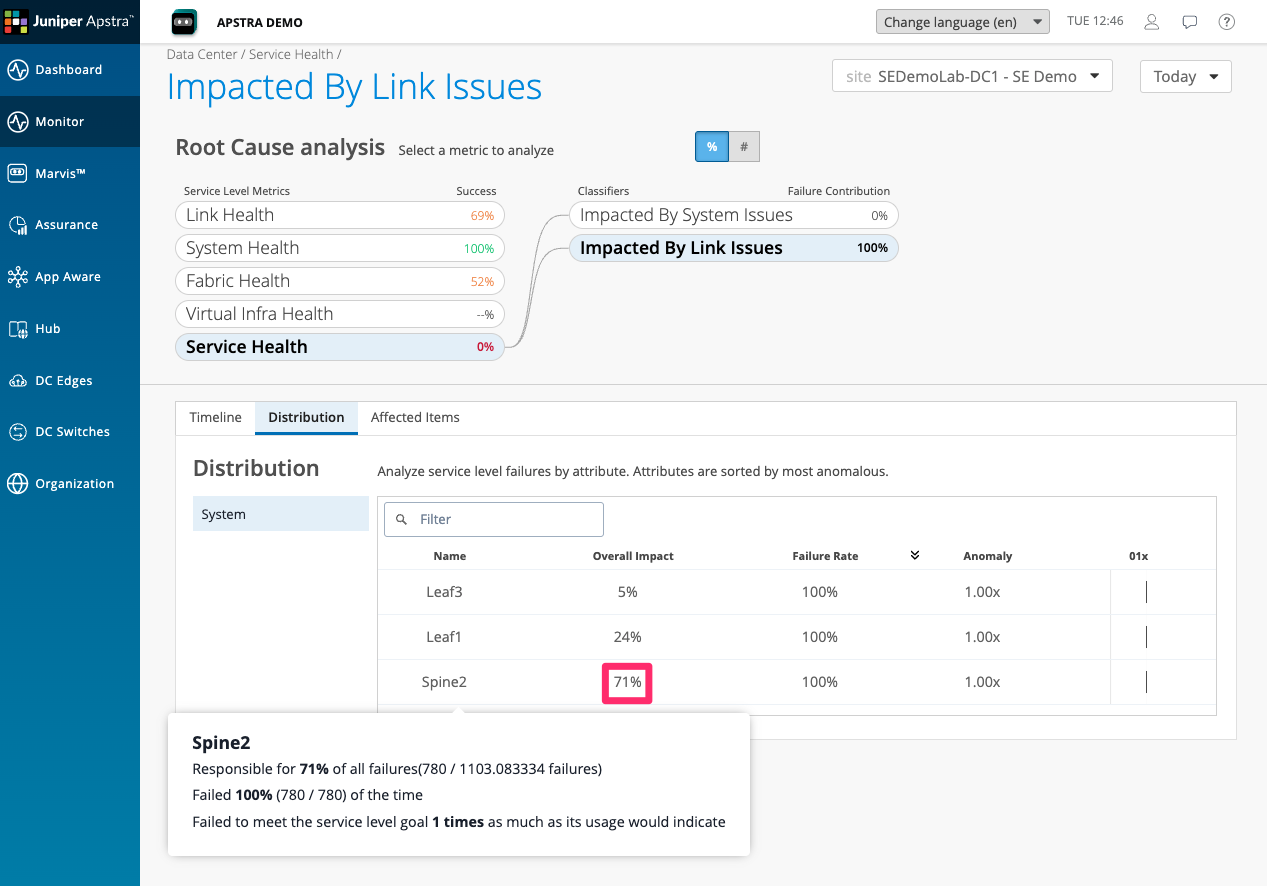
Service Health is at 0% in this demo environment — a significant degradation, meaning the network is not delivering a good experience for a large proportion of the services it is carrying.
The classifier breakdown shows two classifiers beneath Service Health: Impacted by Link Issues and Impacted by System Issues. Impacted by Link Issues is contributing the majority of the degradation.
This is the first piece of information that tells you where to look next. The service experience is poor, and the cause is link quality — not device configuration, not control-plane issues, but physical link conditions in the fabric.
Drilling further into link issues, we can see, looking at the distribution, that Spine2 is responsible for 71% of the overall service health impact.
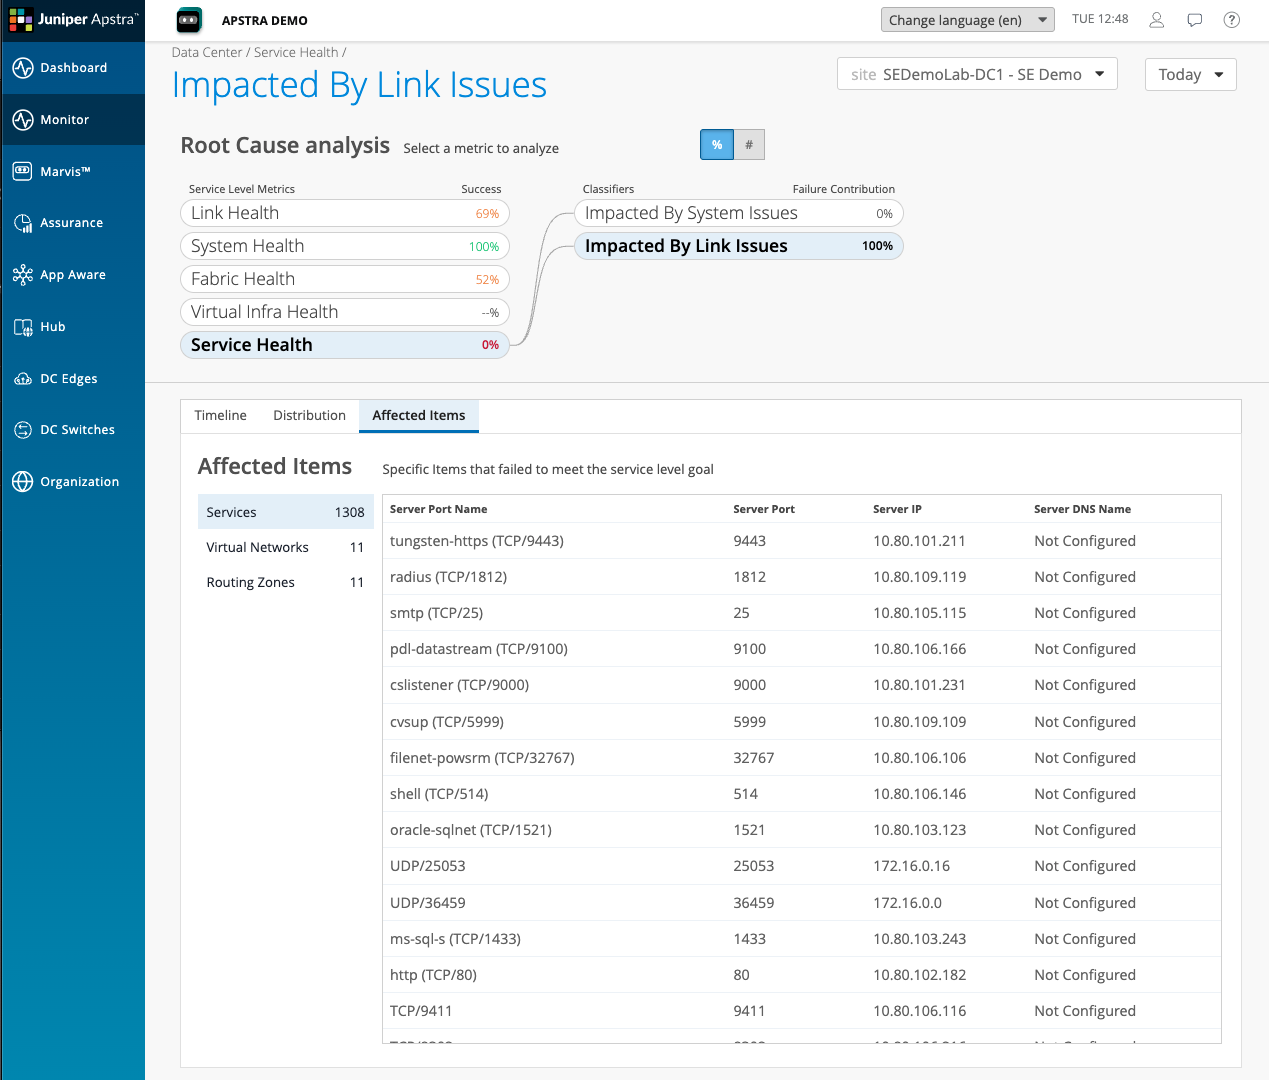
Click through to Affected Items to see the specific Sevices and network overlays They are impacted By the link issues within the fabric .
Moving to Link Health
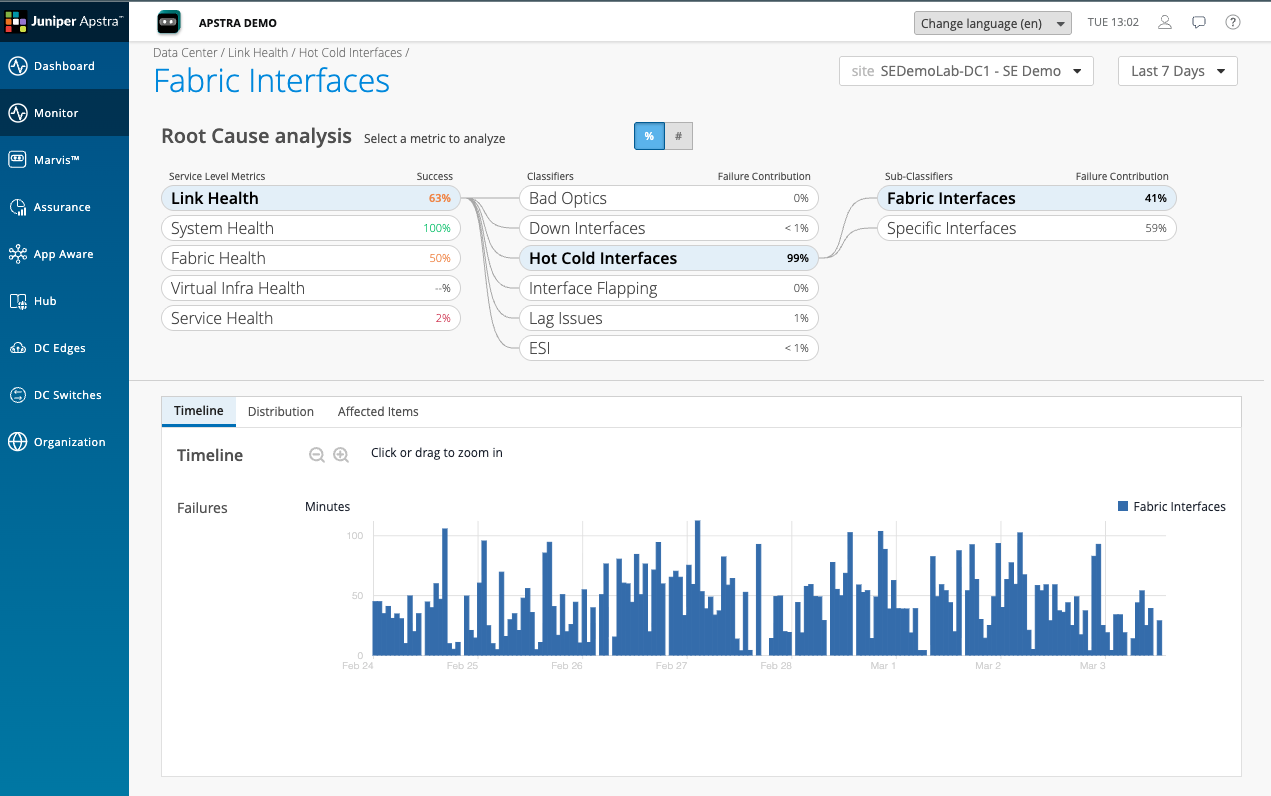
Navigate back to the SLE overview and click on Link Health. The score here is 69%.
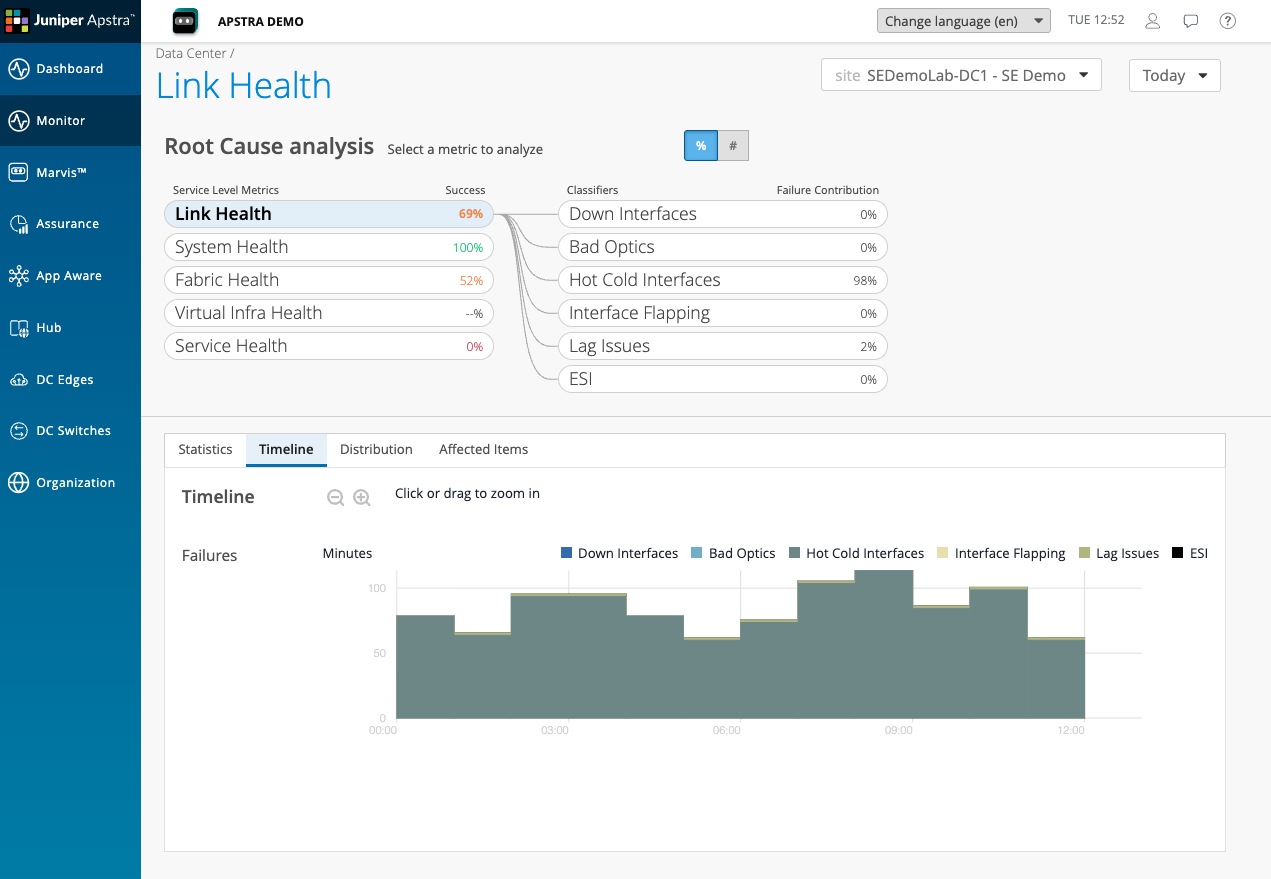
The Link Health classifier breakdown shows that Hot Cold Interfaces is contributing 98% of the link degradation. This is the specific condition driving both the Link Health score and, via that, the Service Health score.
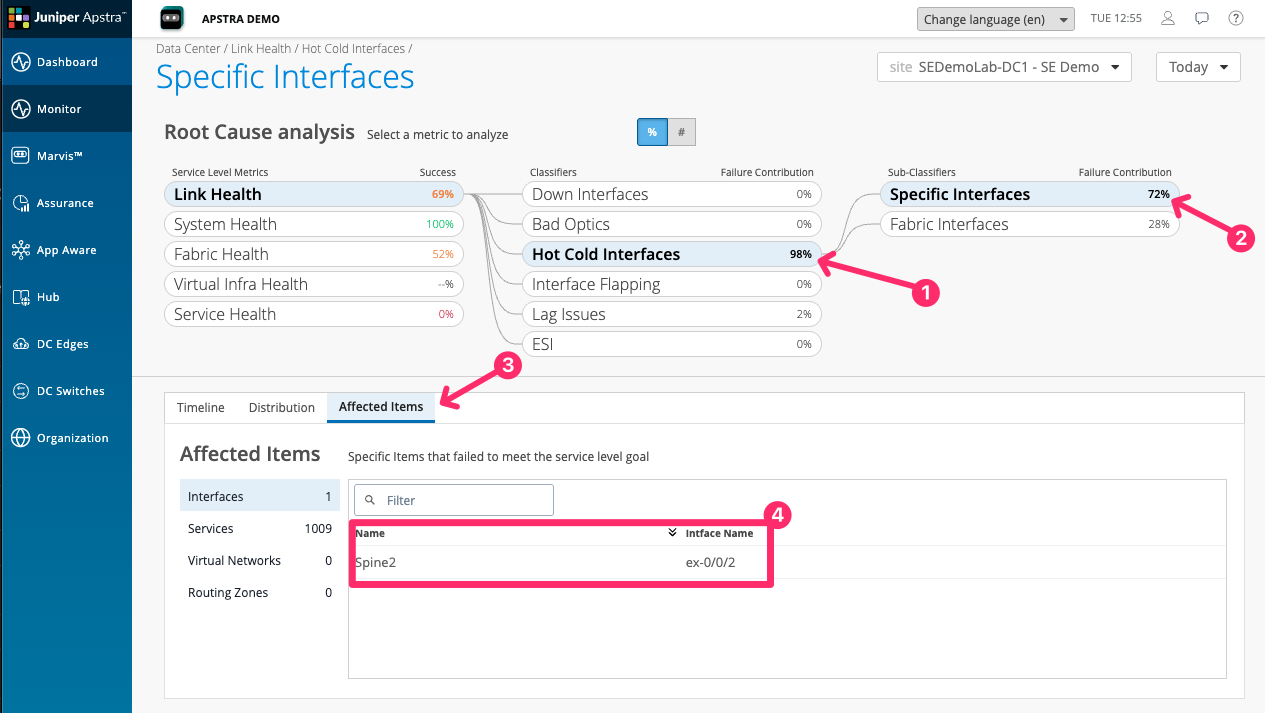
Click on Hot Cold Interfaces. The detail view shows the specific interfaces in the fabric experiencing utilisation imbalance — some links carrying significantly more traffic than others, despite the fabric being designed for equal-cost load balancing.
|
A Hot Cold Interface condition It means that an interface has exceeded or is lower than a threshold set an Apstra DC Director probe. This is not a condition that DC Assurance is detecting from raw metrics. It is a condition that DC Assurance is inheriting from Apstra Data Center Director’s model-based monitoring. The probe is configured to look for utilisation across links and DC Assurance is showing you the result of that probe with all of the context attached. A Fabric Interface is any interface that is between a Leaf Spine and Super Spine, and not interfaces that face external systems such as servers, storage devices, or other data centres. Specific interfaces are ones that the user has specifically asked to monitor. This could be for things like essential services that are important to them. |
Showing the trend lines
Before leaving this scenario, navigate to the Timeline view for Link Health or Service Health. Look for the time range selector at the top of the screen and set it to show the last 24 hours.
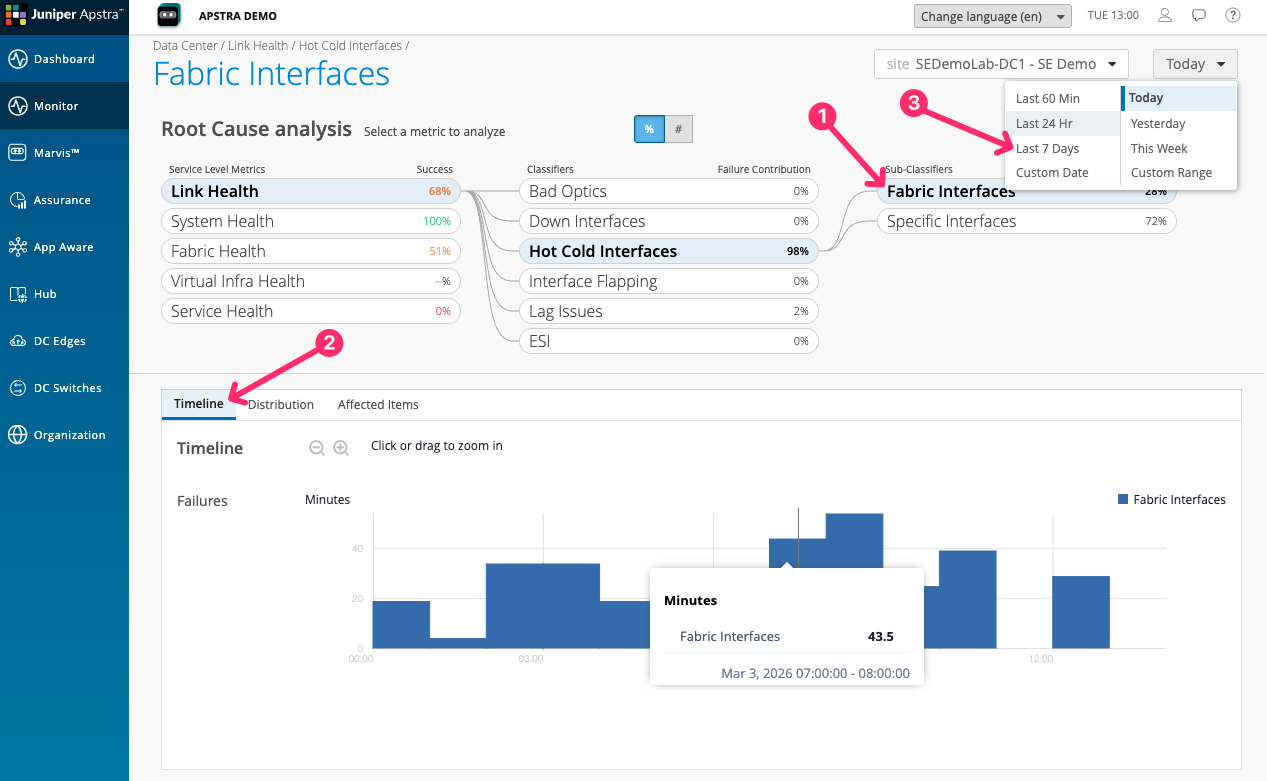
The trend lines show that DC Assurance has been tracking these conditions continuously. This is the point about continuous monitoring: the information exists before the support call arrives.
Think about how much of the data you need to diagnose a network problem already exists in your tools today — and how much you have to reconstruct after the fact. That gap is what continuous SLE monitoring closes.