Section 5: Monitoring, analytics, and rollback
Estimated time: 10 minutes
|
Instructor pause — on-prem flow analytics demo This section begins with an instructor-led demo on the flow server at the front of the room. If you have arrived here and that demo has not started yet, skip ahead to Section 4.2 and continue from there. The instructor will pause the class and bring everyone back to Section 4.1 when the time comes. |
4.1 On-prem analytics — Intent-Based Analytics and live traffic data
Follow along with the instructor’s demo on your own environment.
Two views, two different questions
You have now made several commits to a live fabric. Before you start monitoring, it is worth understanding that Apstra gives you two fundamentally different ways to look at the network — and they answer different questions.
-
Navigate back to your blueprint main view.
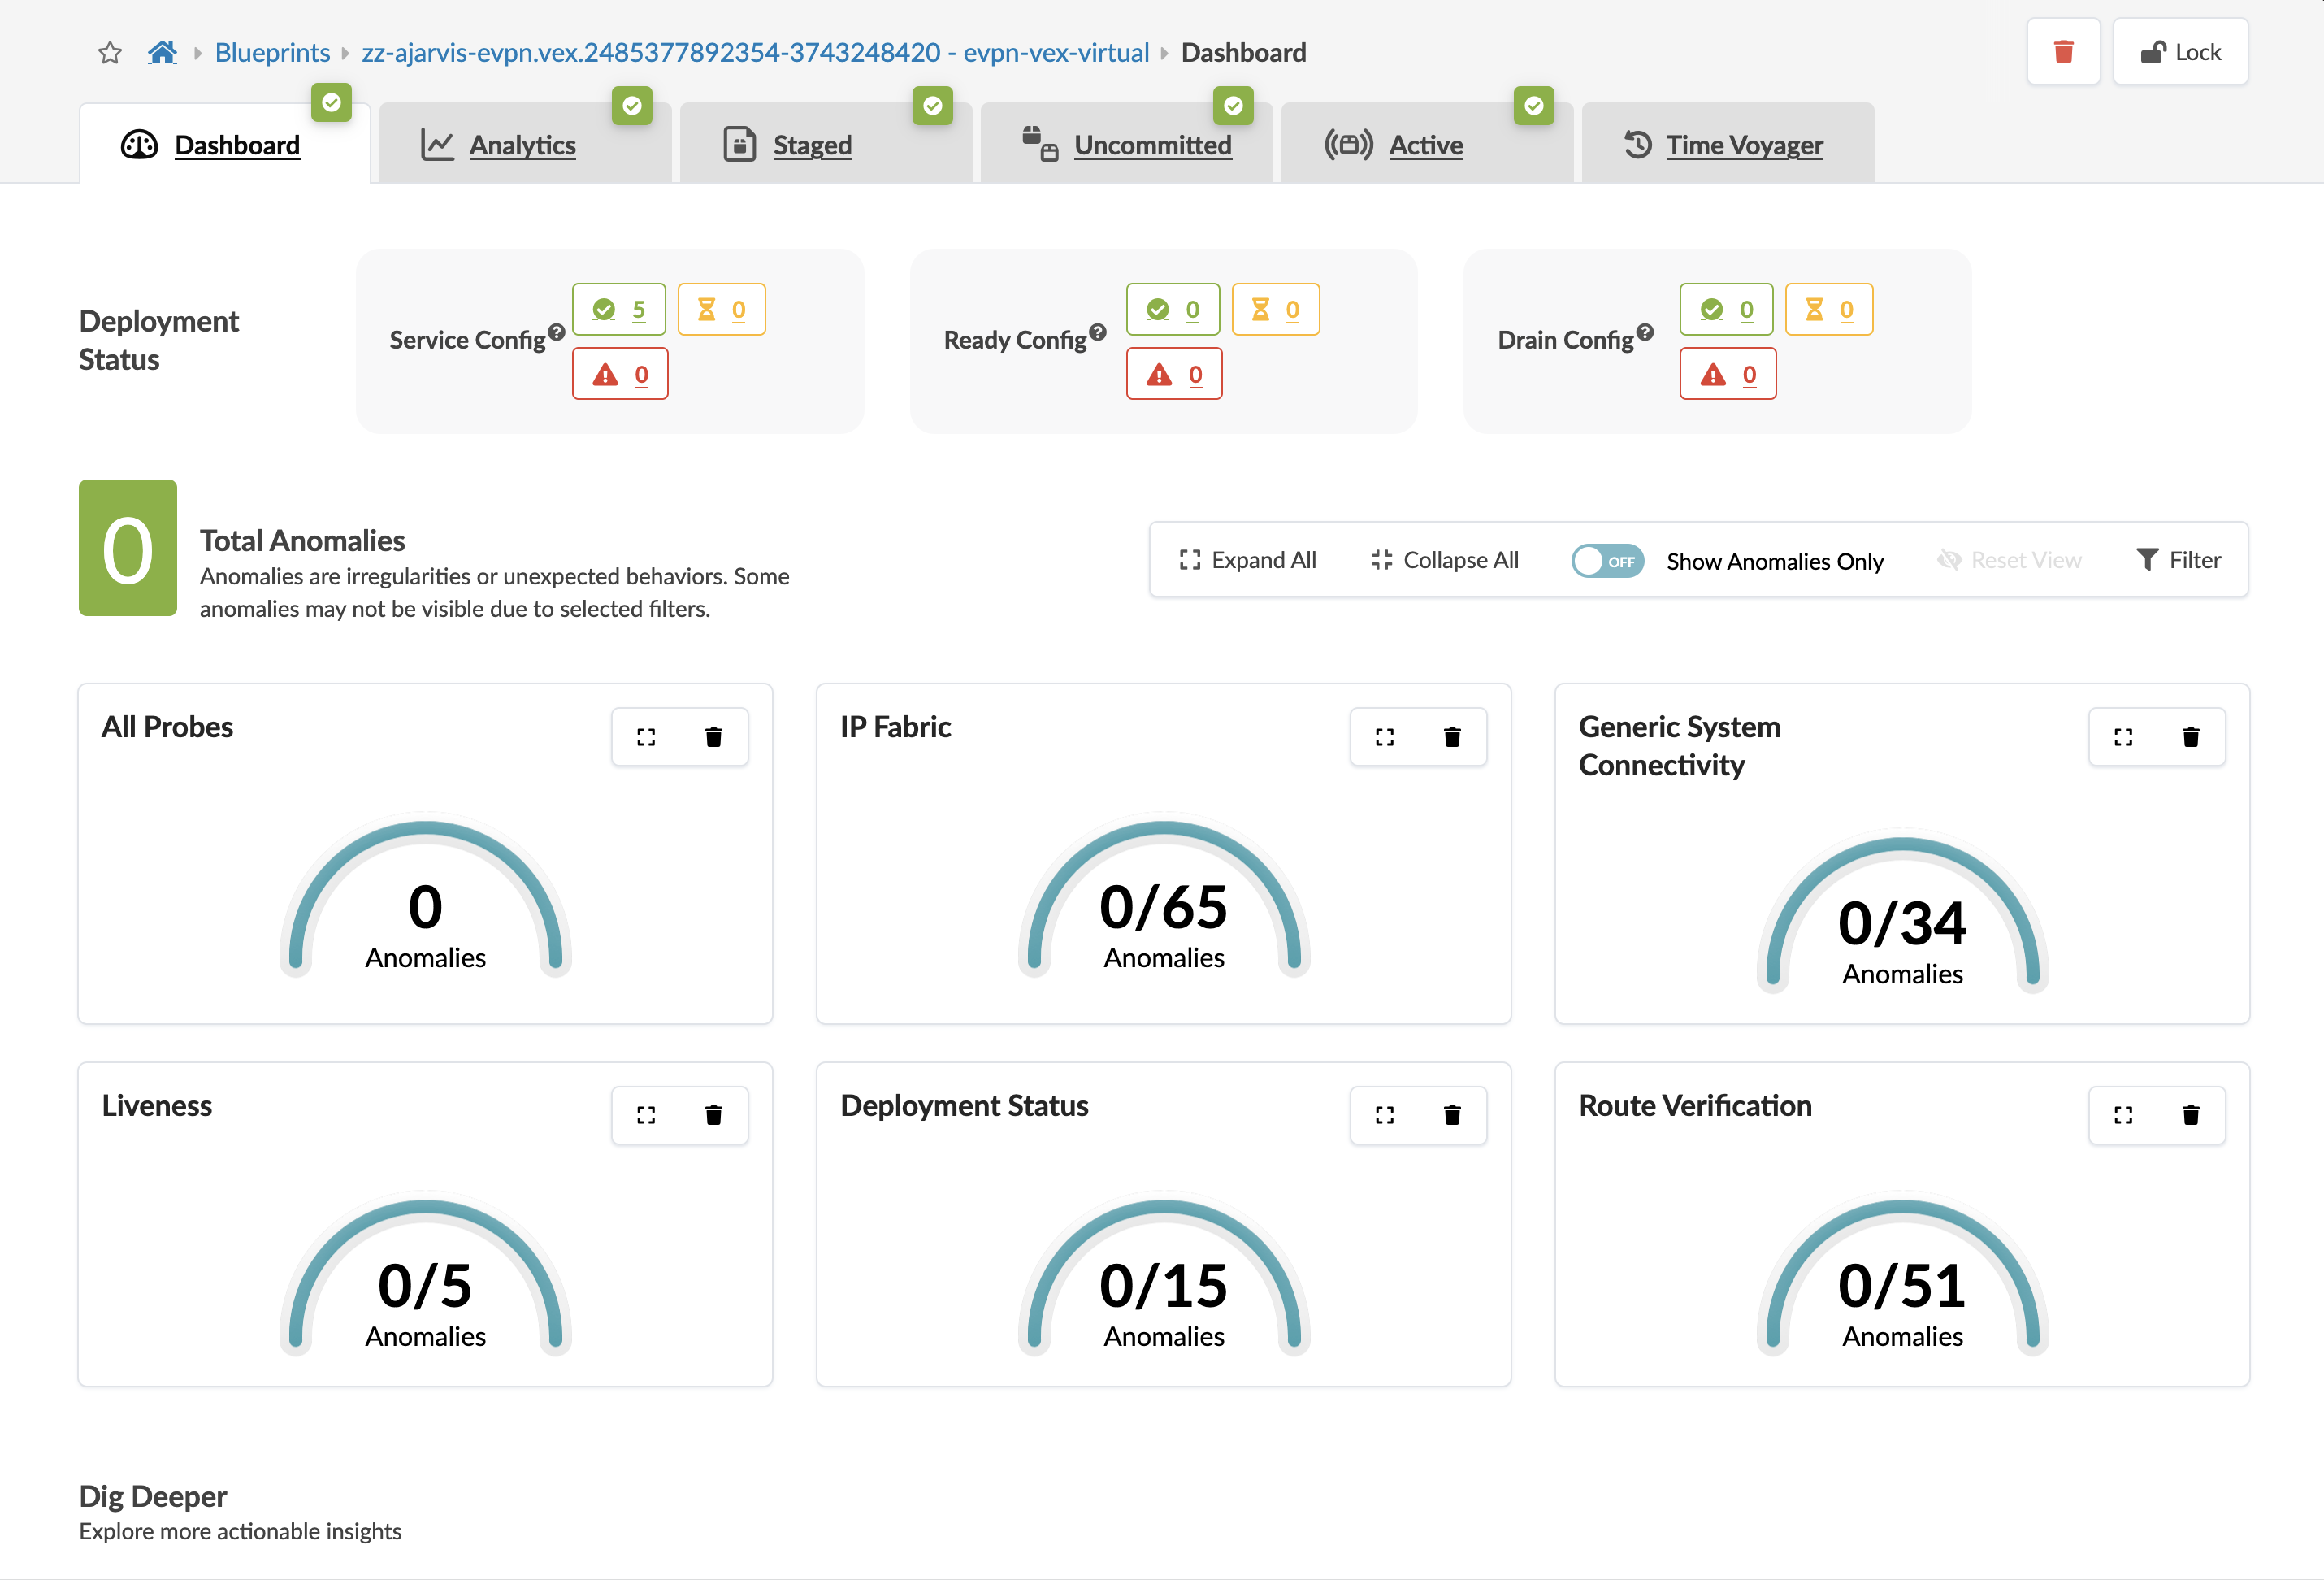
The main dashboard answers "what is wrong right now?" — issues that are actively affecting the fabric and need immediate attention.
-
Navigate to Analytics in the left-hand menu.
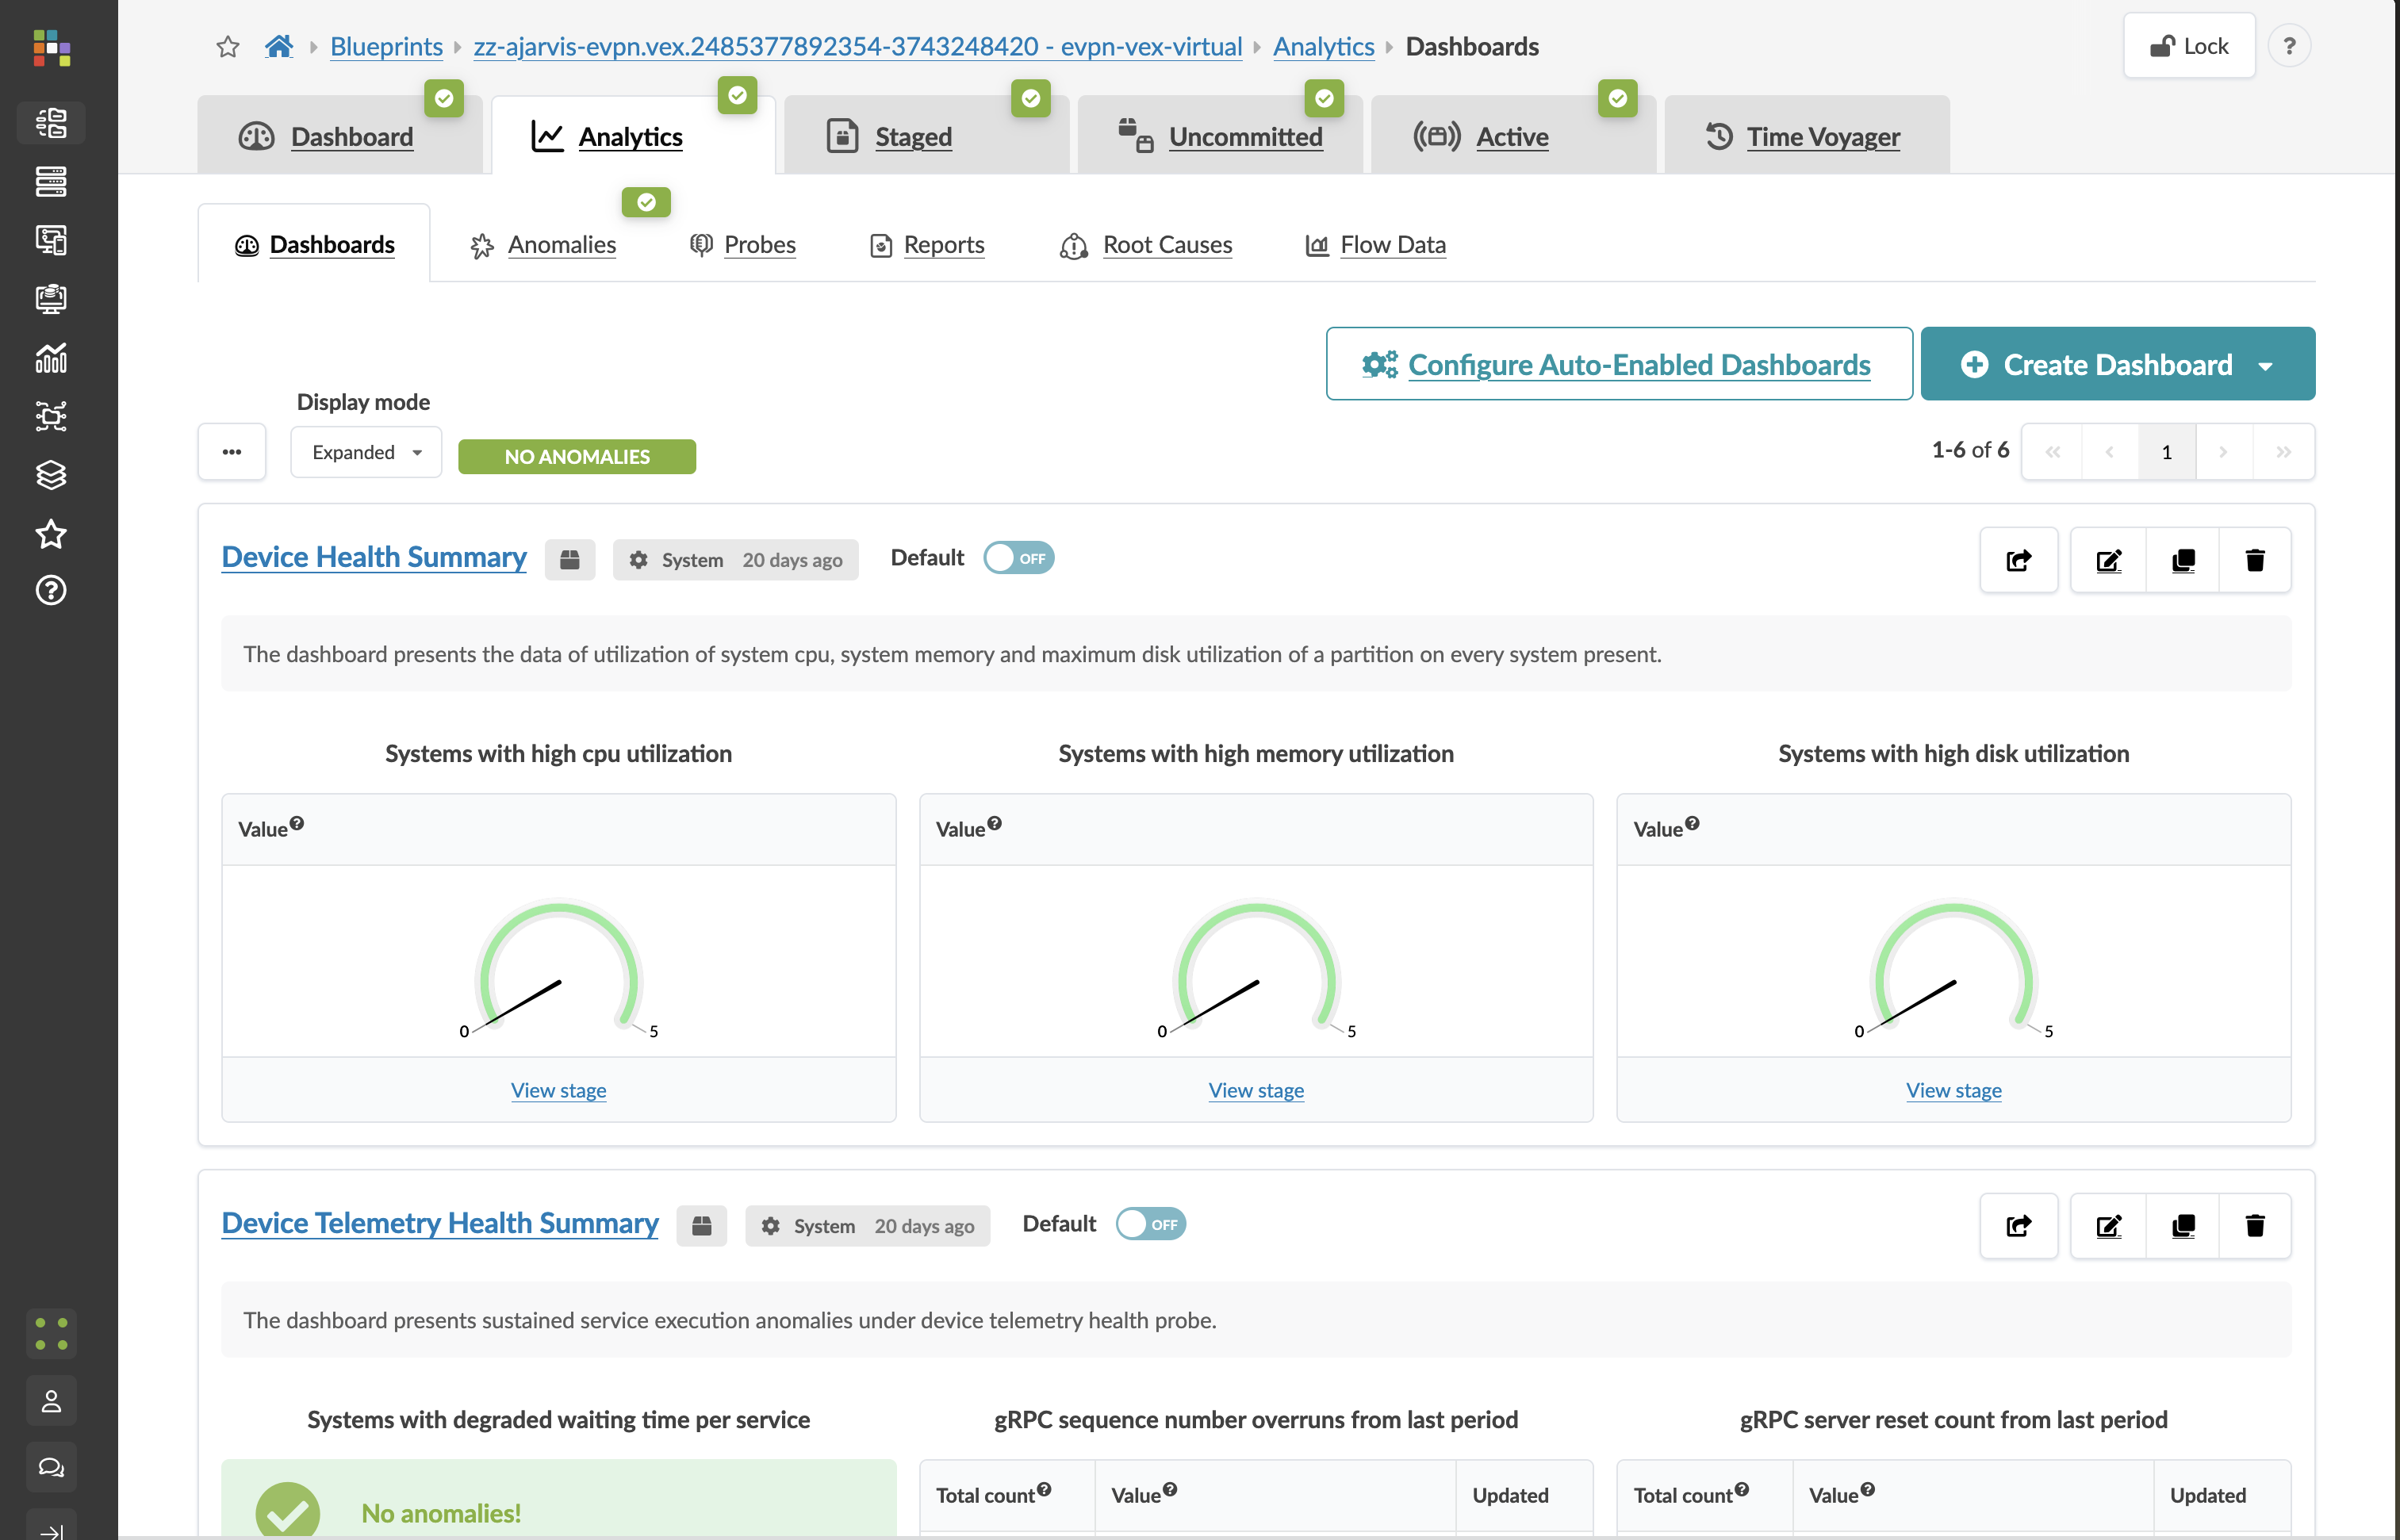
The analytics dashboard answers "how is my network performing?" — trends, utilisation patterns, and signals that could indicate problems before they become critical.
|
The difference that matters: A conventional monitoring tool might report "15 BGP peers are up" with no issues. Apstra would flag that as an anomaly if your design specifies 12 peers — because 15 deviates from intent, regardless of whether all 15 are healthy. That context is only possible because Apstra holds your complete design intent, not just the current device state. |
Intent-Based Analytics (IBA) — three layers
IBA is Apstra’s telemetry and analytics system. It evaluates the data your switches generate against something meaningful — your design intent — rather than just against a threshold that you set manually.
IBA works across three layers:
| Layer | What it does |
|---|---|
Built-in detections |
Always running. Catches fundamental deviations: configuration drift, unreachable devices, link flaps, BGP session failures. No setup required. |
Predefined probes |
Ready-to-activate analytics. Interface error rates, packet discards, BGP session stability, bandwidth utilisation. Activate the ones relevant to your environment from the Probes menu. |
Custom telemetry |
Create your own collectors to pull any streaming telemetry data your switches expose, and visualise it alongside everything else. |
The practical value of all three layers is the same — context. When a probe raises an anomaly, you already know exactly which device, which interface, and how it relates to the network’s intended state.
4.2 Exploring anomalies in a running fabric
You briefly looked at anomalies in Section 1, before you had made any changes. Now that you have committed several changes to the fabric, let’s revisit the anomaly view — the historical timeline will show you the activity from your session.
-
From your blueprint, click the Anomalies tab.
Each entry shows the expected state alongside the actual state. This is not a generic alert — it is the exact deviation from design intent, with the fabric context attached.
-
Change the time range to view the past 30 days.
The historical view shows when issues appeared, when they were resolved, and how they track against the changes you made. This is the view you reach for when you need to understand what was happening on the fabric before a problem was reported — not just what is wrong right now.
|
If you are investigating a recurring issue, the history view often reveals the pattern — the same anomaly appearing at predictable times, or a slow drift that started after a specific commit. Neither of those patterns is visible in a tool that only shows current state. |
4.3 Troubleshooting directly from the blueprint
When an anomaly points to a specific device, you usually want to run a few show commands to confirm what is happening. In a traditional environment, that means opening a separate SSH session, finding the device’s management IP, and switching tools. In Apstra, you can do it without leaving the UI.
-
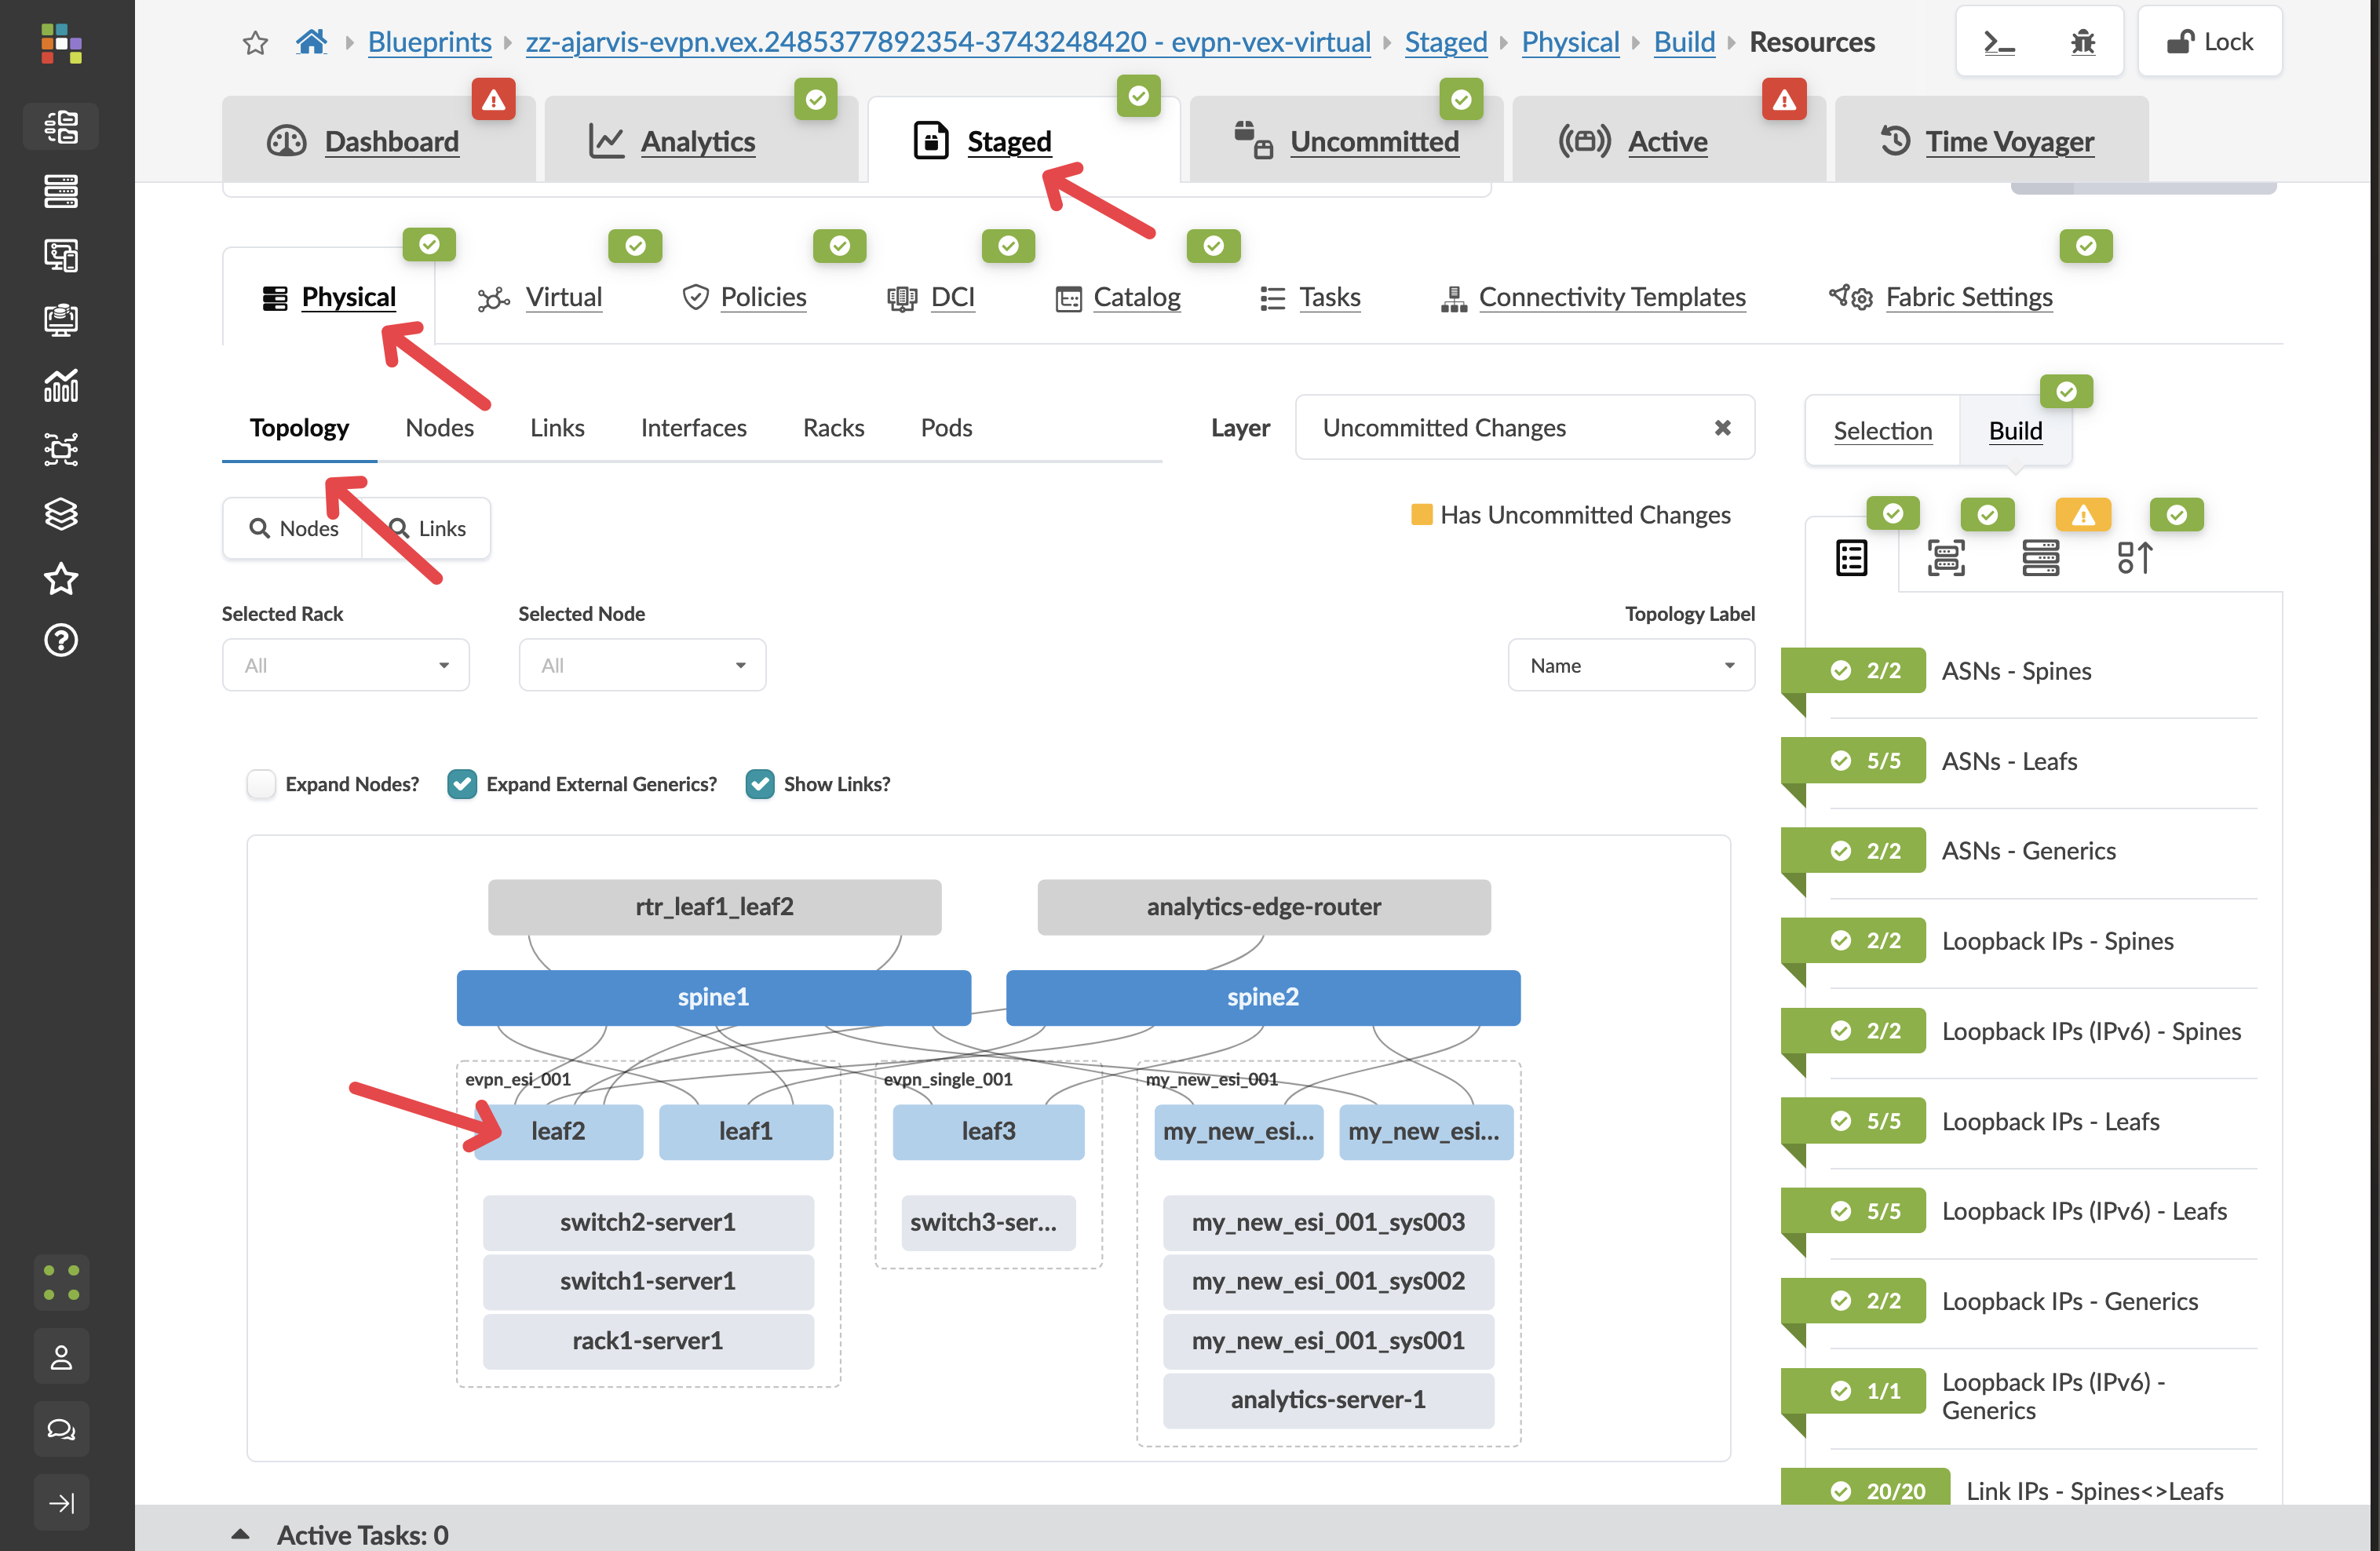
Navigate to menu:Active[Physical > Topology].
-
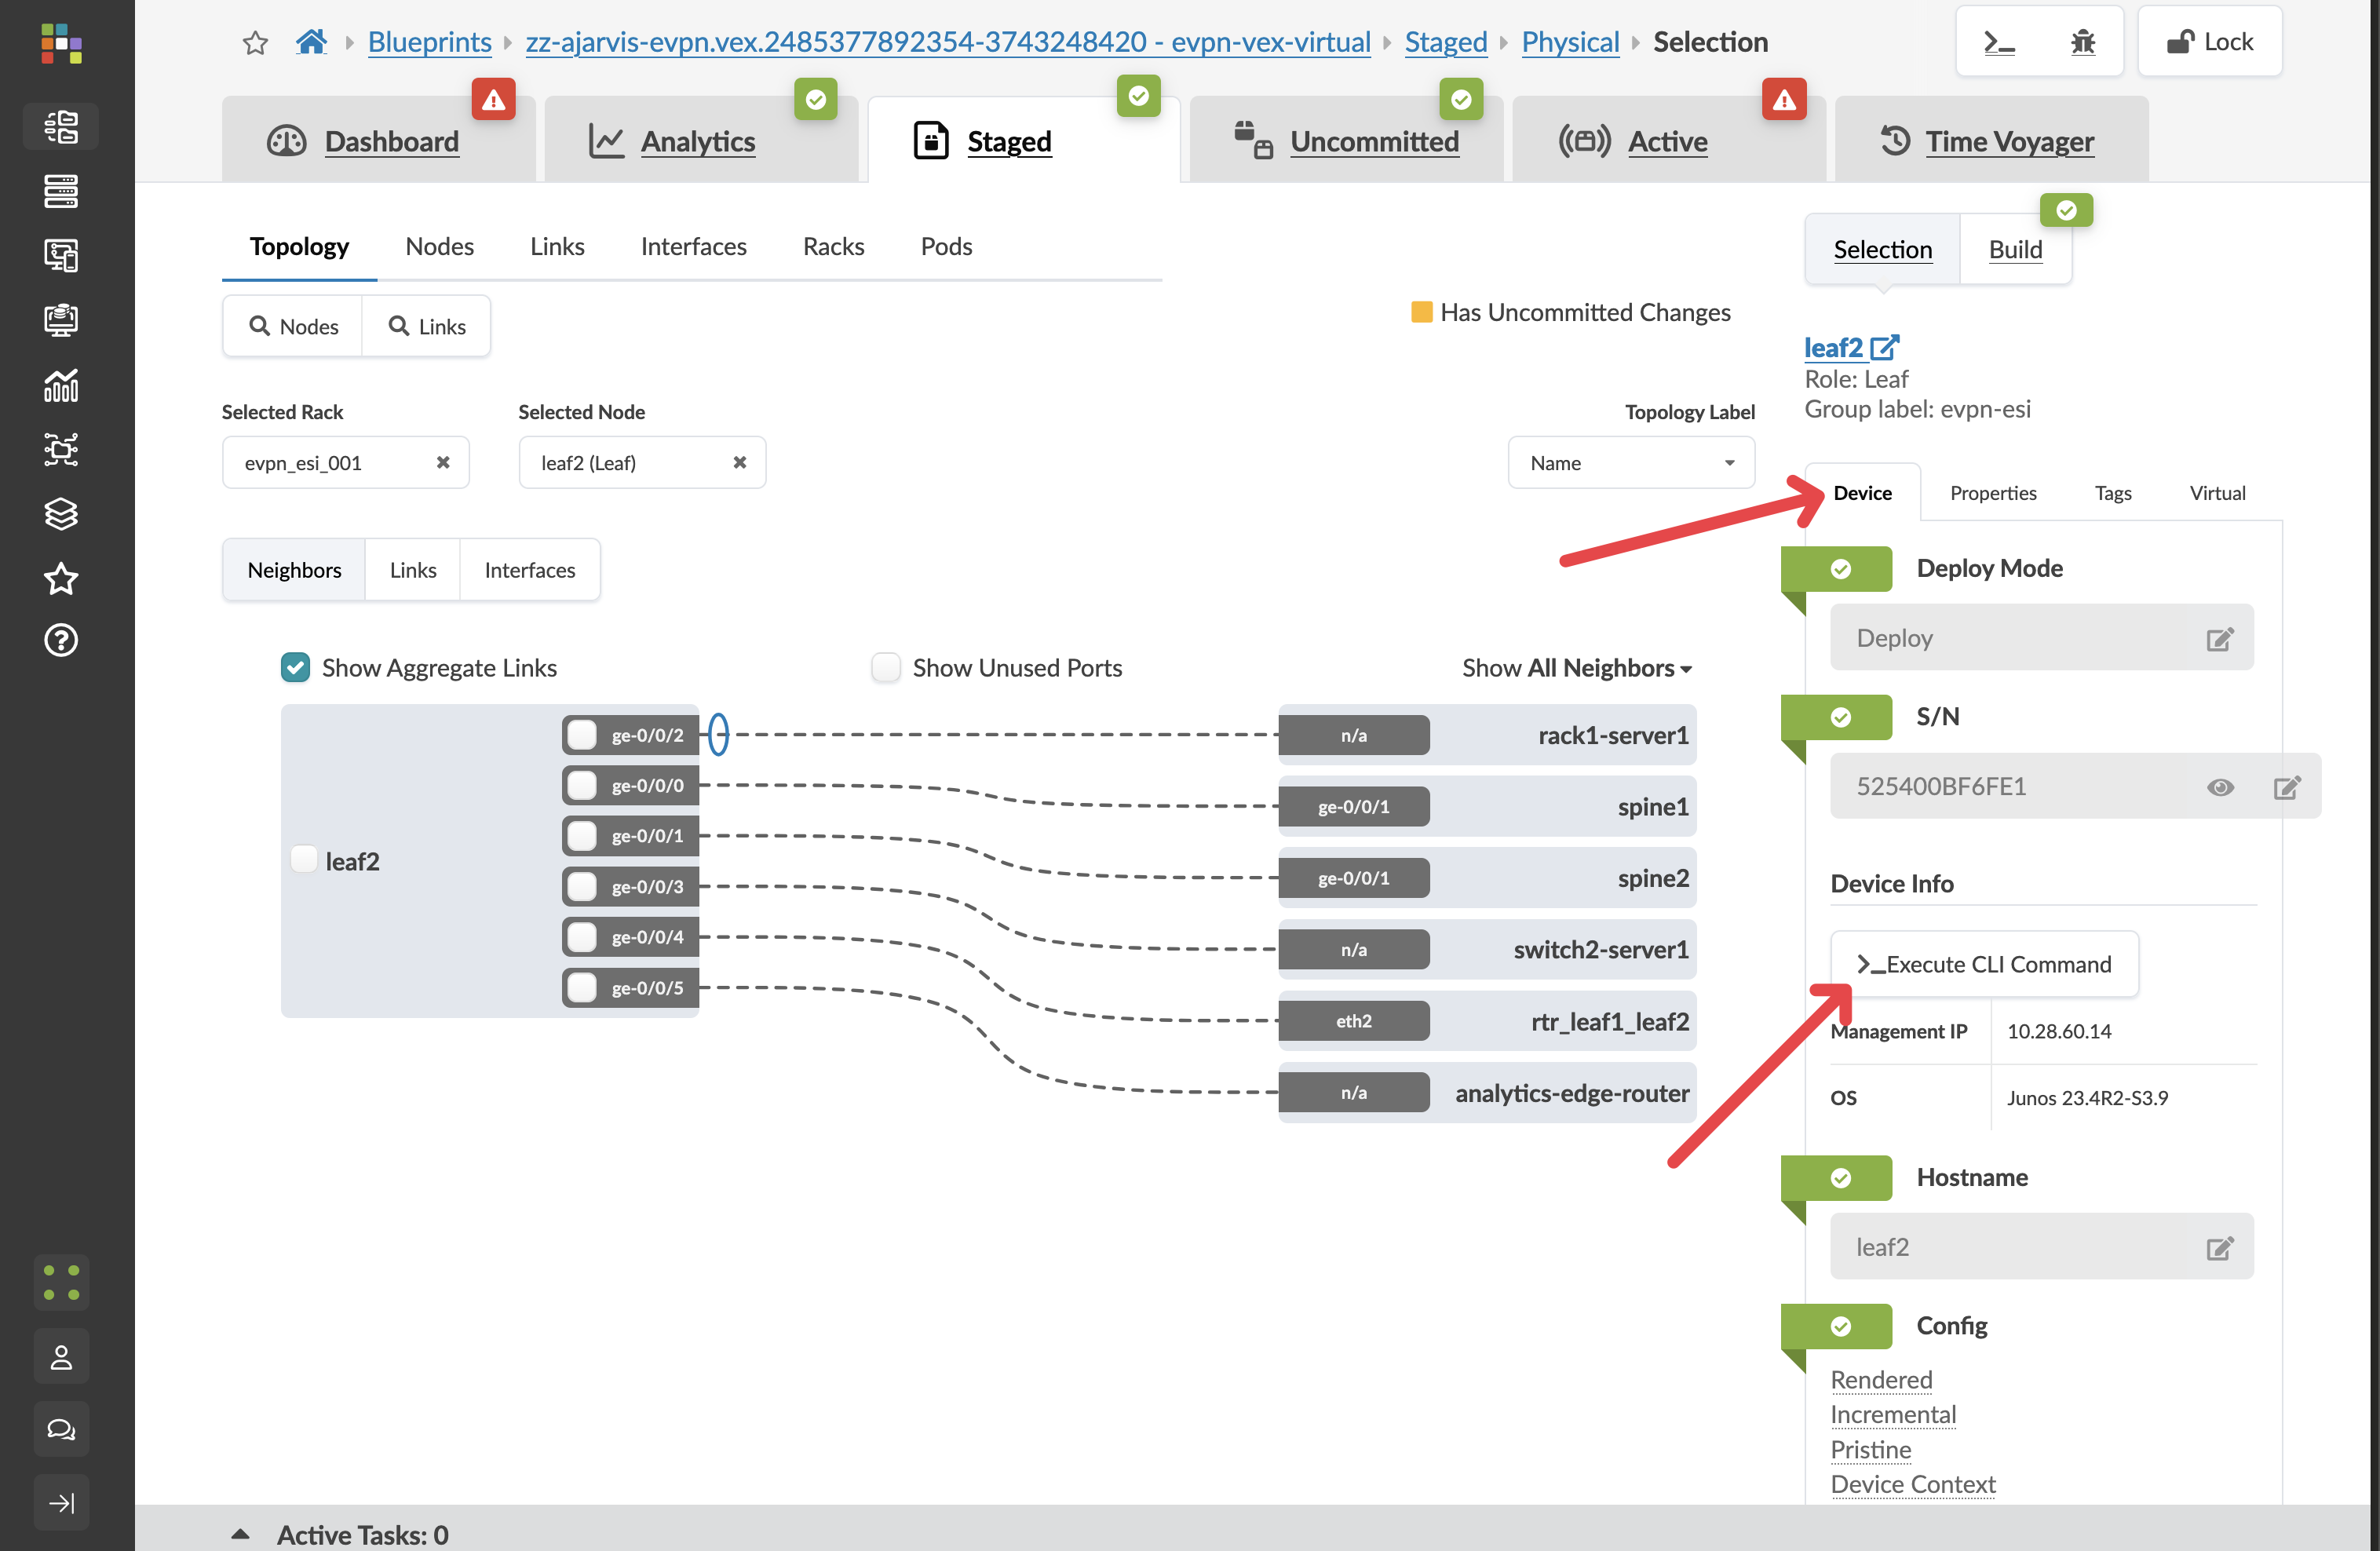
Click on a leaf switch to open its detail panel.
-
In the device panel, click Execute CLI Command.
You can run any Junos show command directly against the device:
show interfaces brief
show bgp summary
show route table
show evpn instance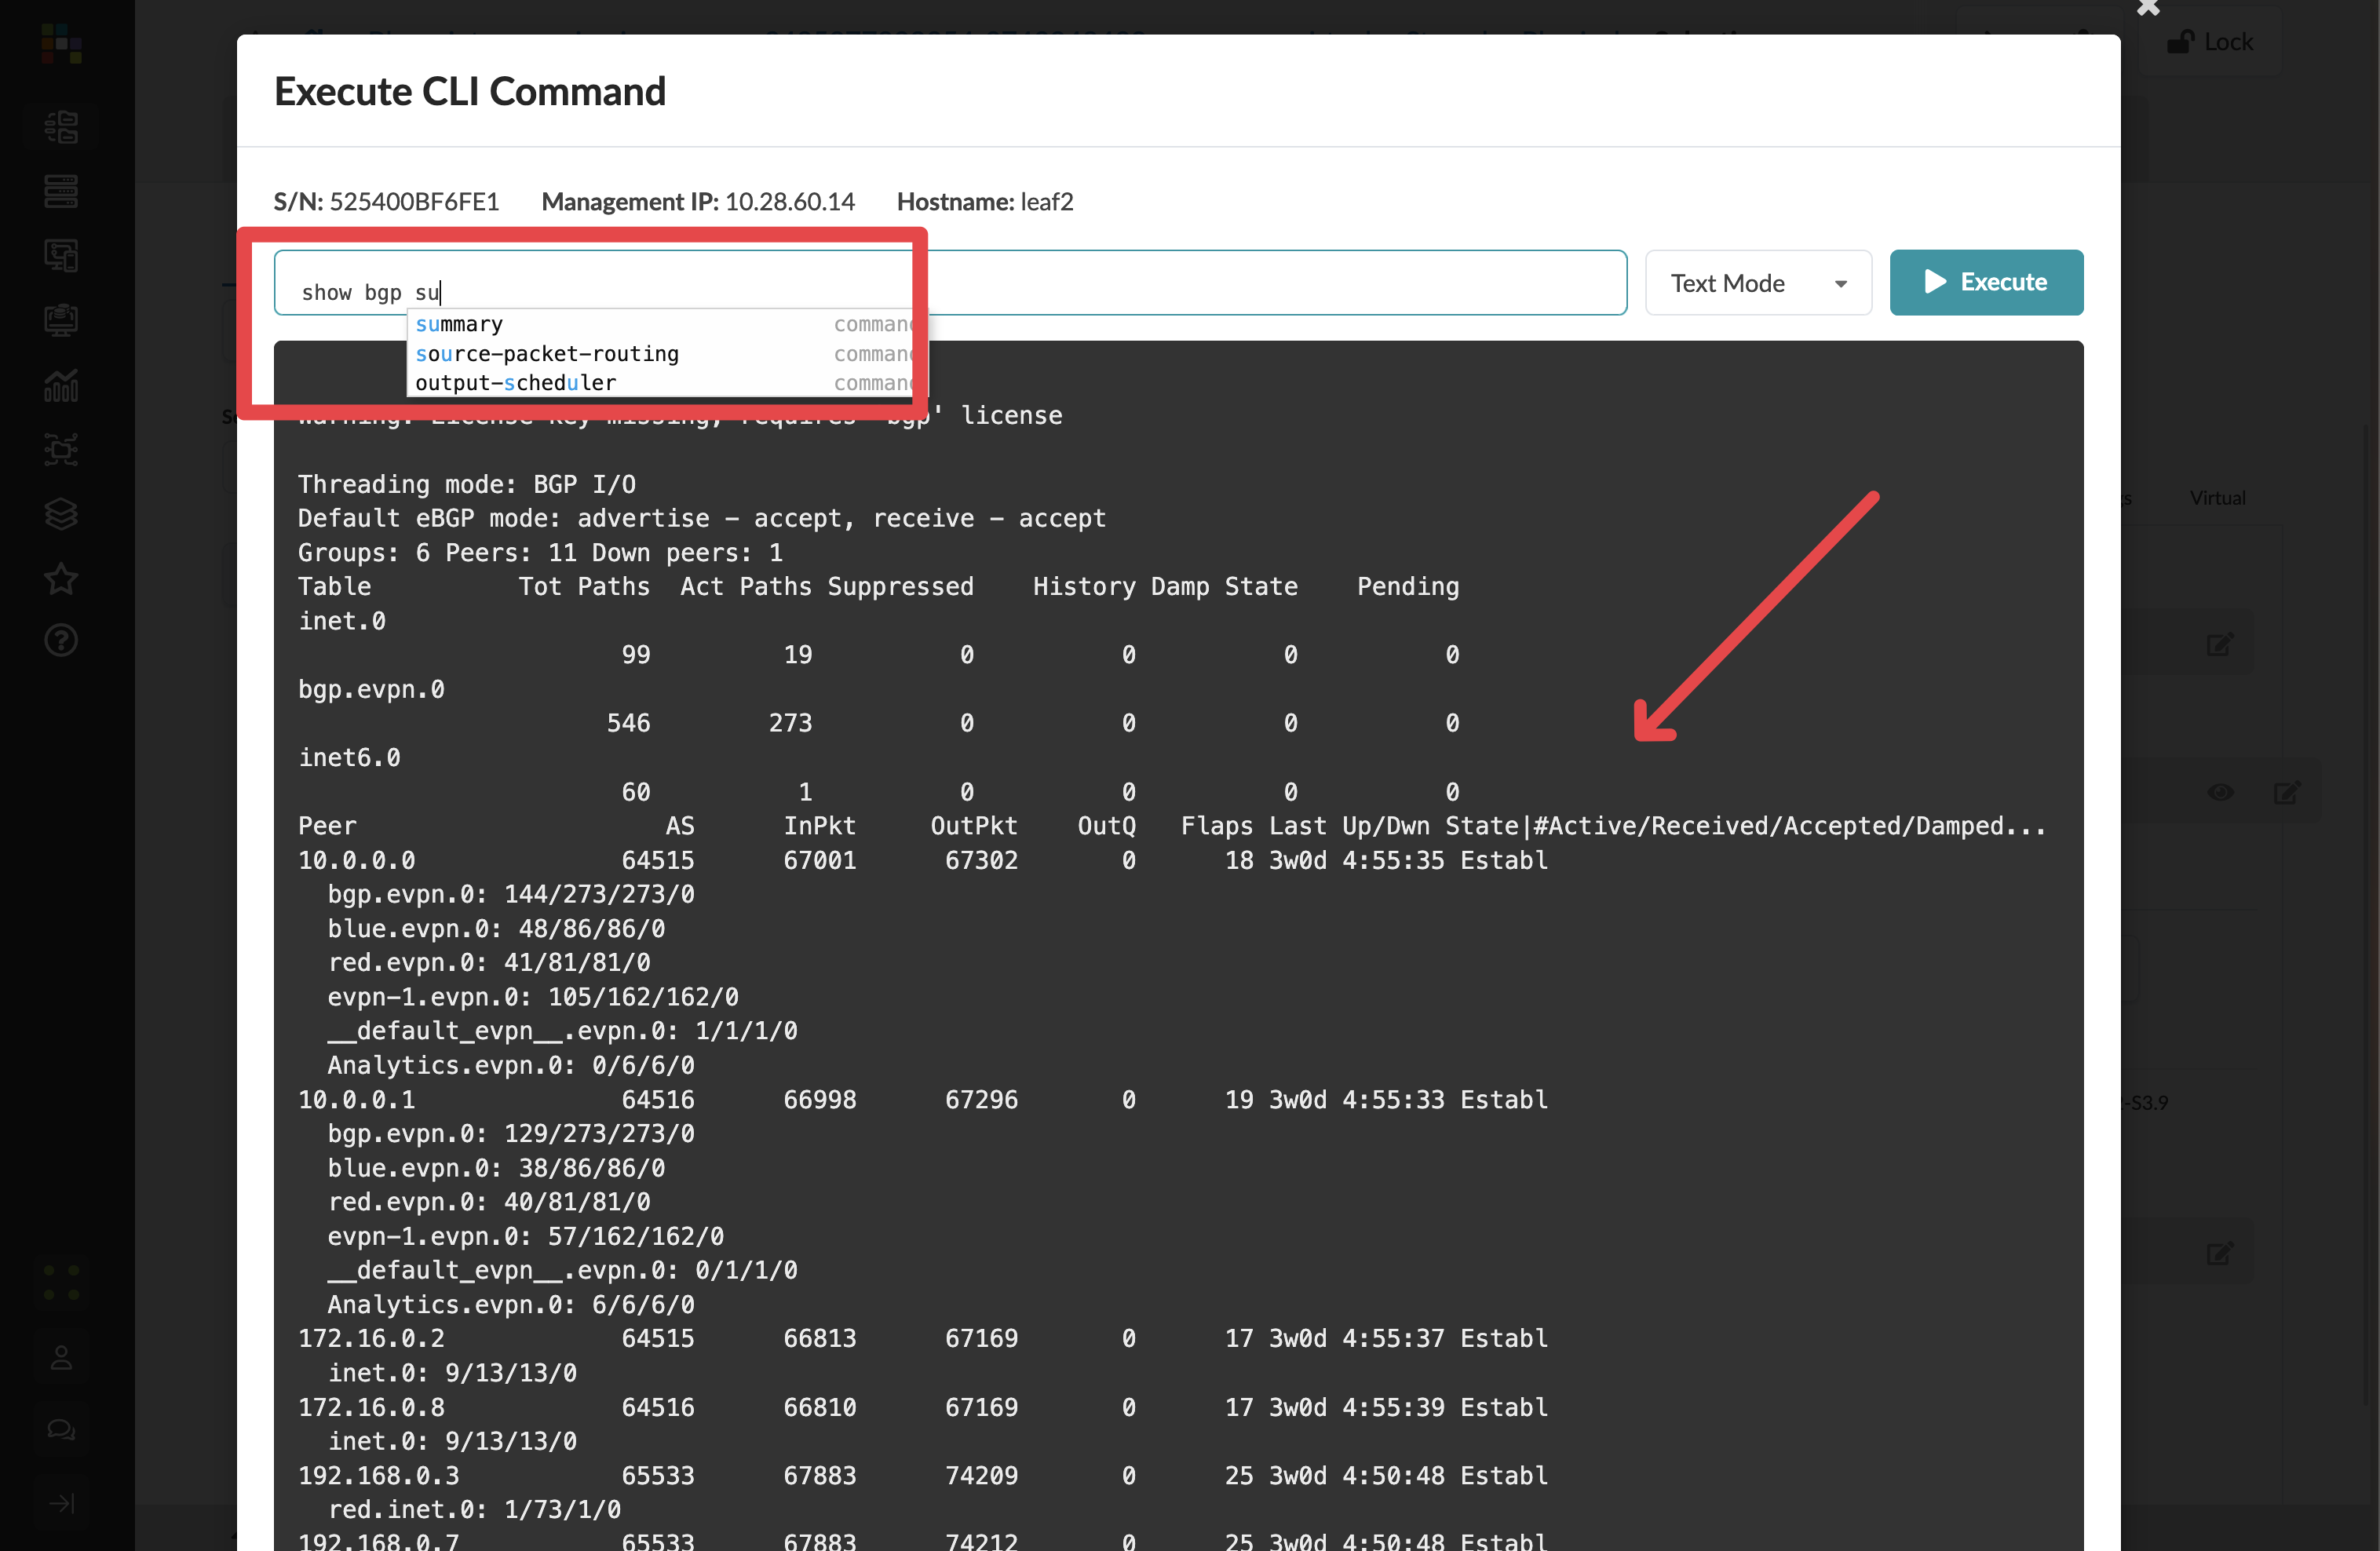
|
The CLI here supports tab-completion, just like the native Junos CLI. The difference is that you already have the full Apstra context visible — you know what this device should be doing before you start investigating what it is actually doing. When those two things do not match, you already know which anomaly to look at. |
4.4 Rolling back with Time Voyager
|
This is where a U can now take over and rollback with time voyager! |
Every commit you have made during this lab is a snapshot. Time Voyager lets you travel back to any of them — and critically, it shows you exactly what would change before you commit to anything.
Think about when you would use this in practice. You commit a change at 2pm. At 3pm, your NOC receives reports of connectivity issues. Time Voyager lets you immediately see what changed in that commit, compare the before-and-after state across every device, and roll back the entire fabric in minutes — not hours.
-
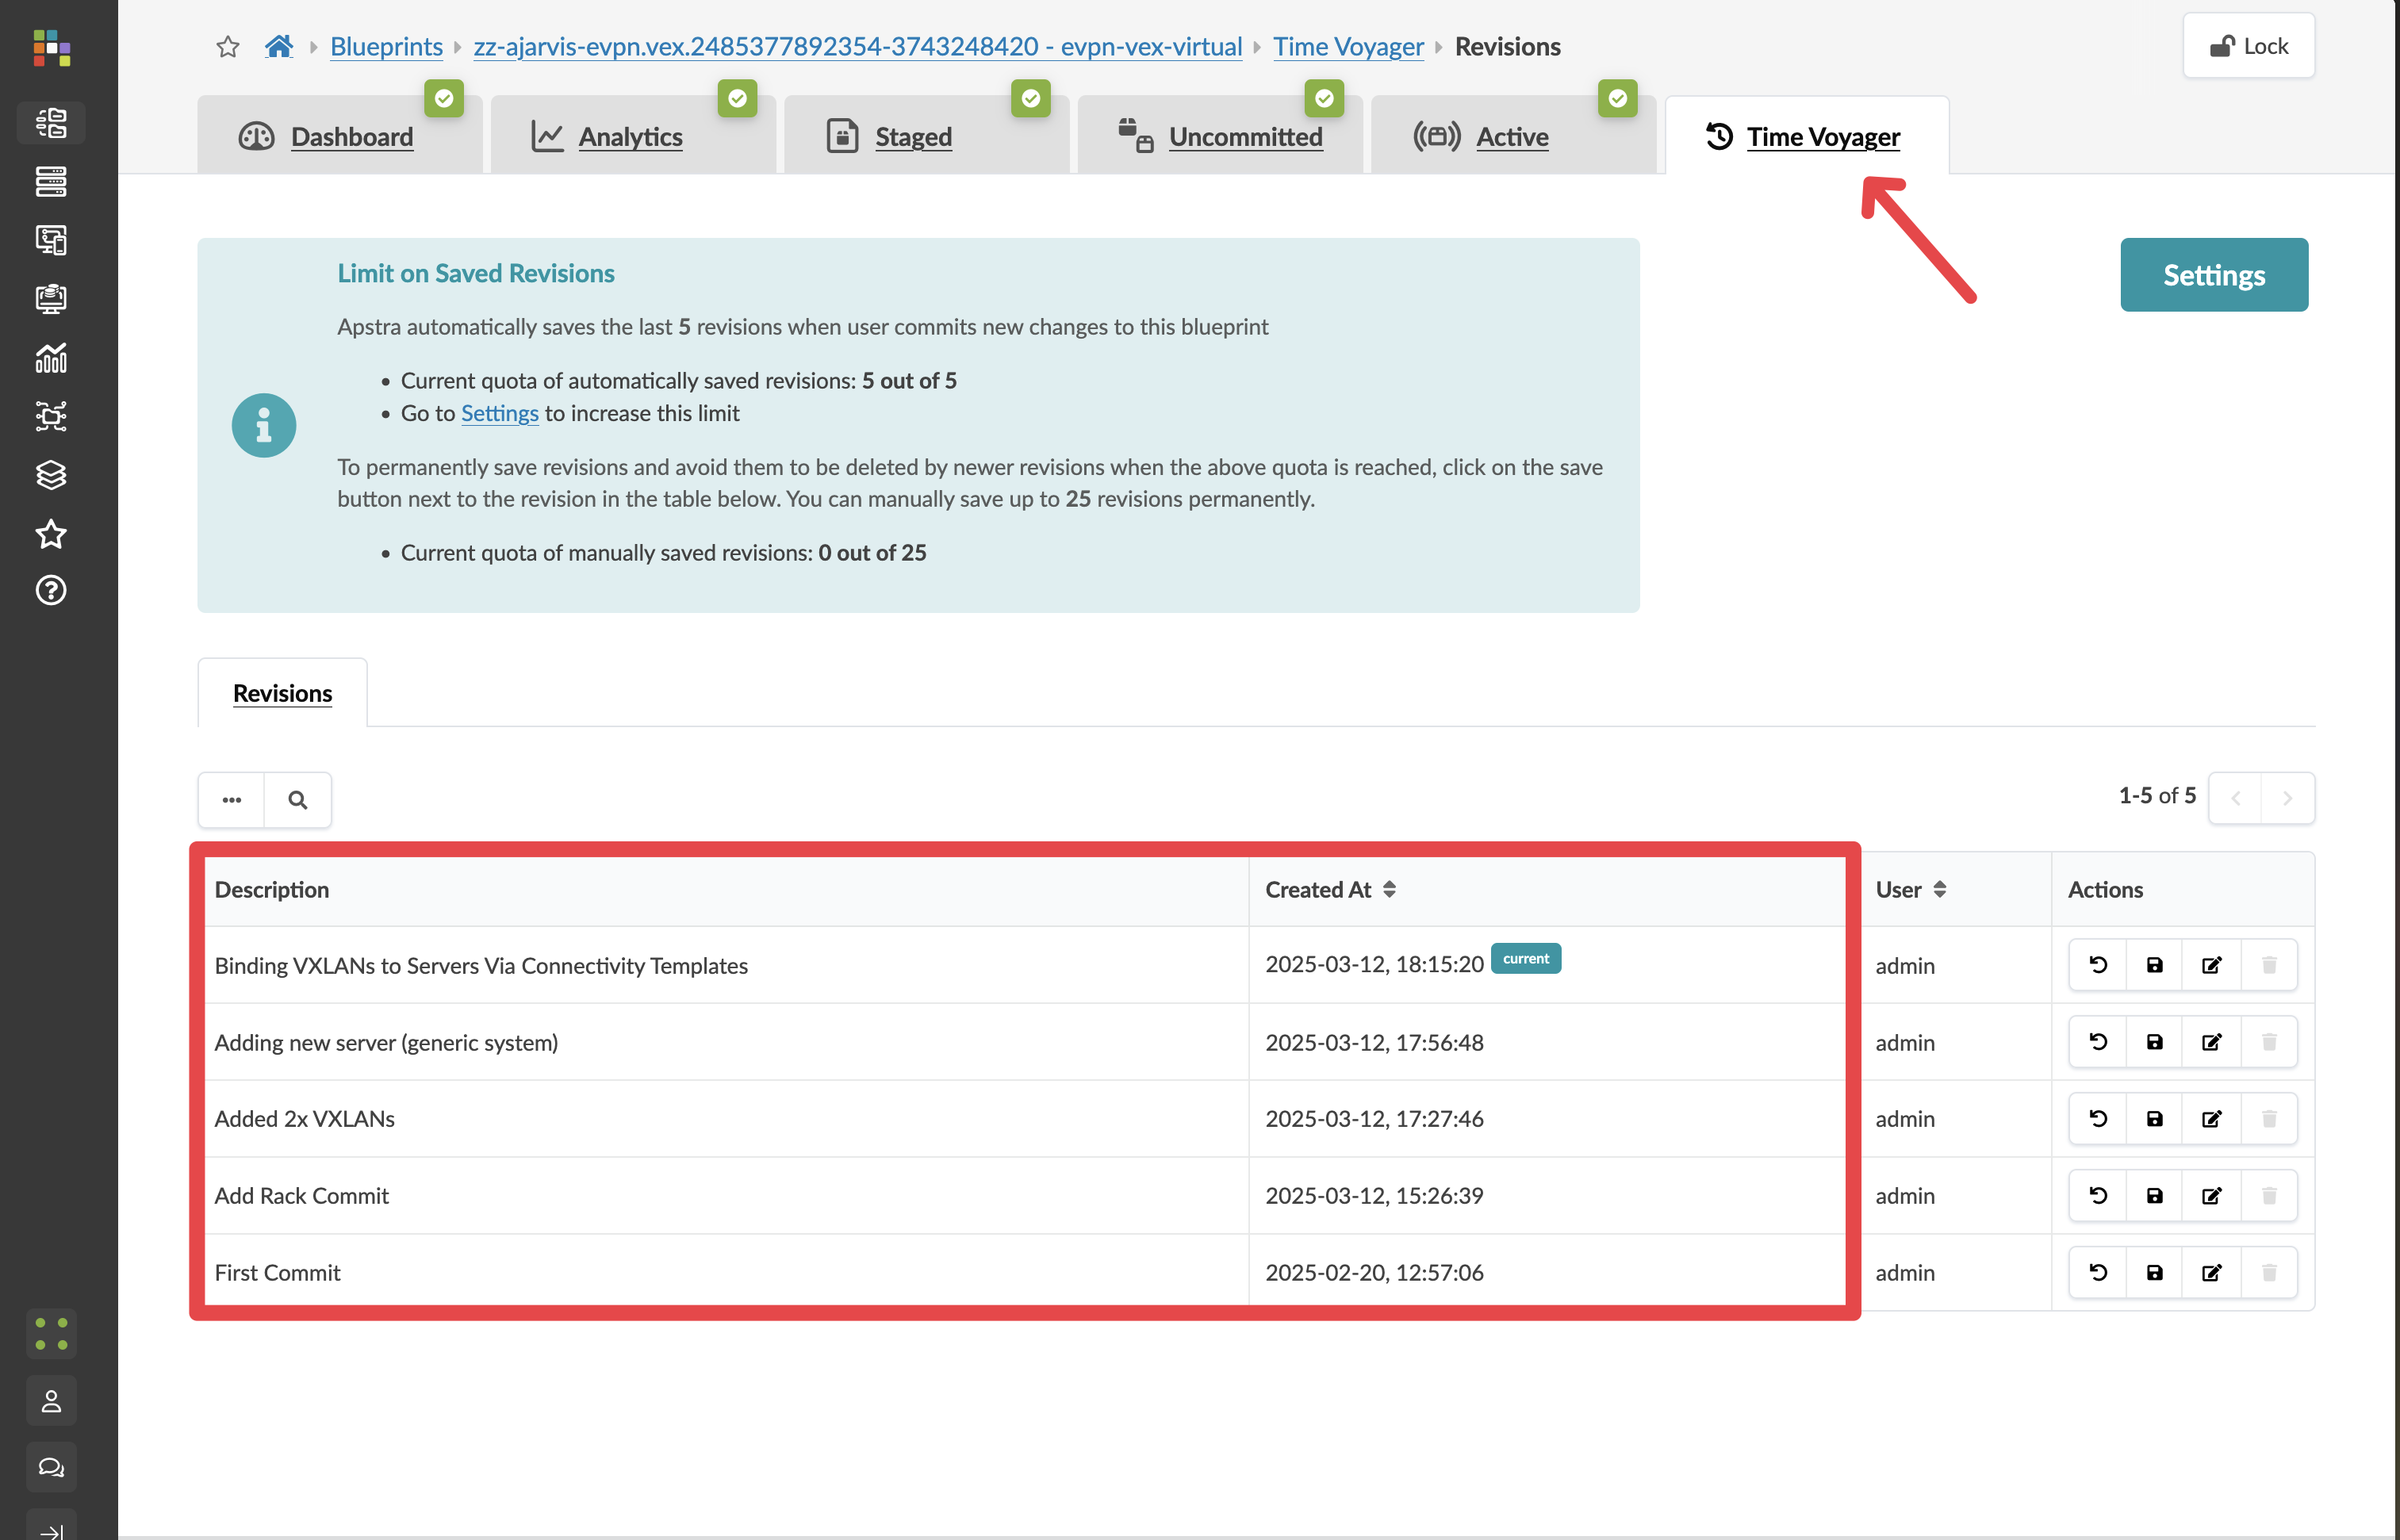
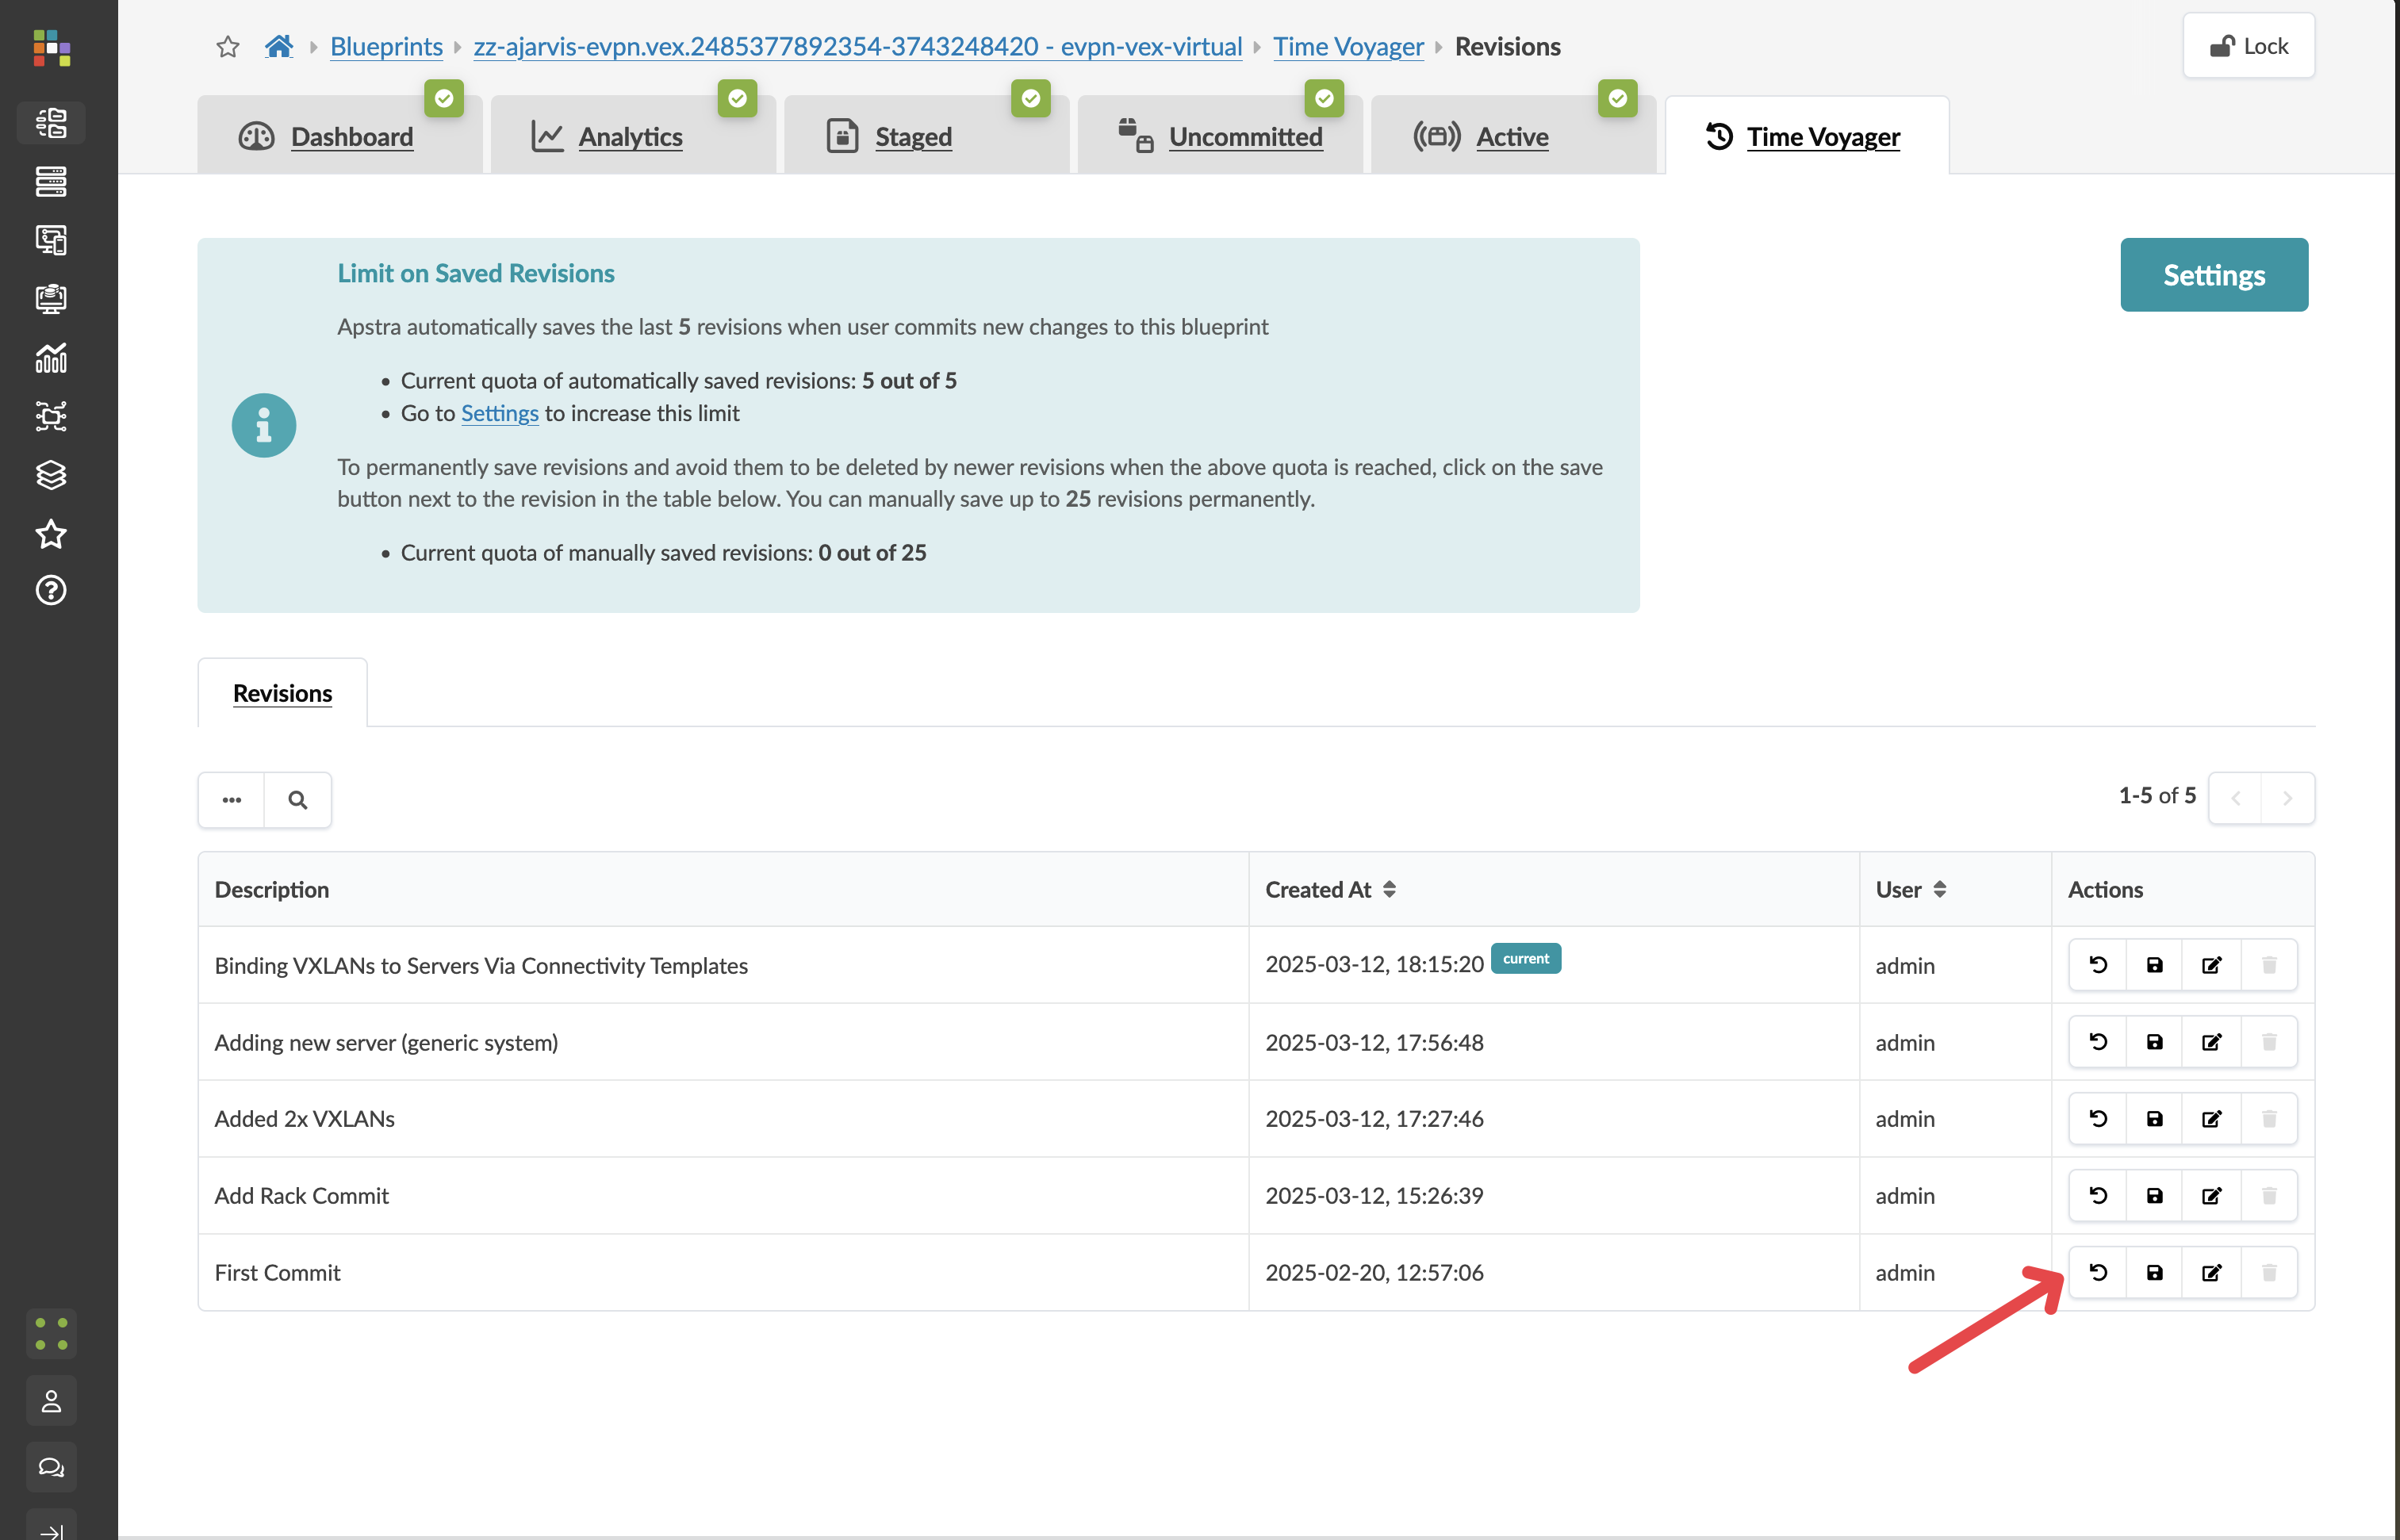
From your blueprint, click the Time Voyager tab at the far right of the screen.
|
Each snapshot shows the timestamp, the commit message, and who made the change. This is your complete, auditable fabric history — one of the reasons commit messages matter. They are what you rely on to find the right point in time when you need it. |
-
Browse the commit history and select a commit from before you added the Analytics components.
-
Click Rollback.
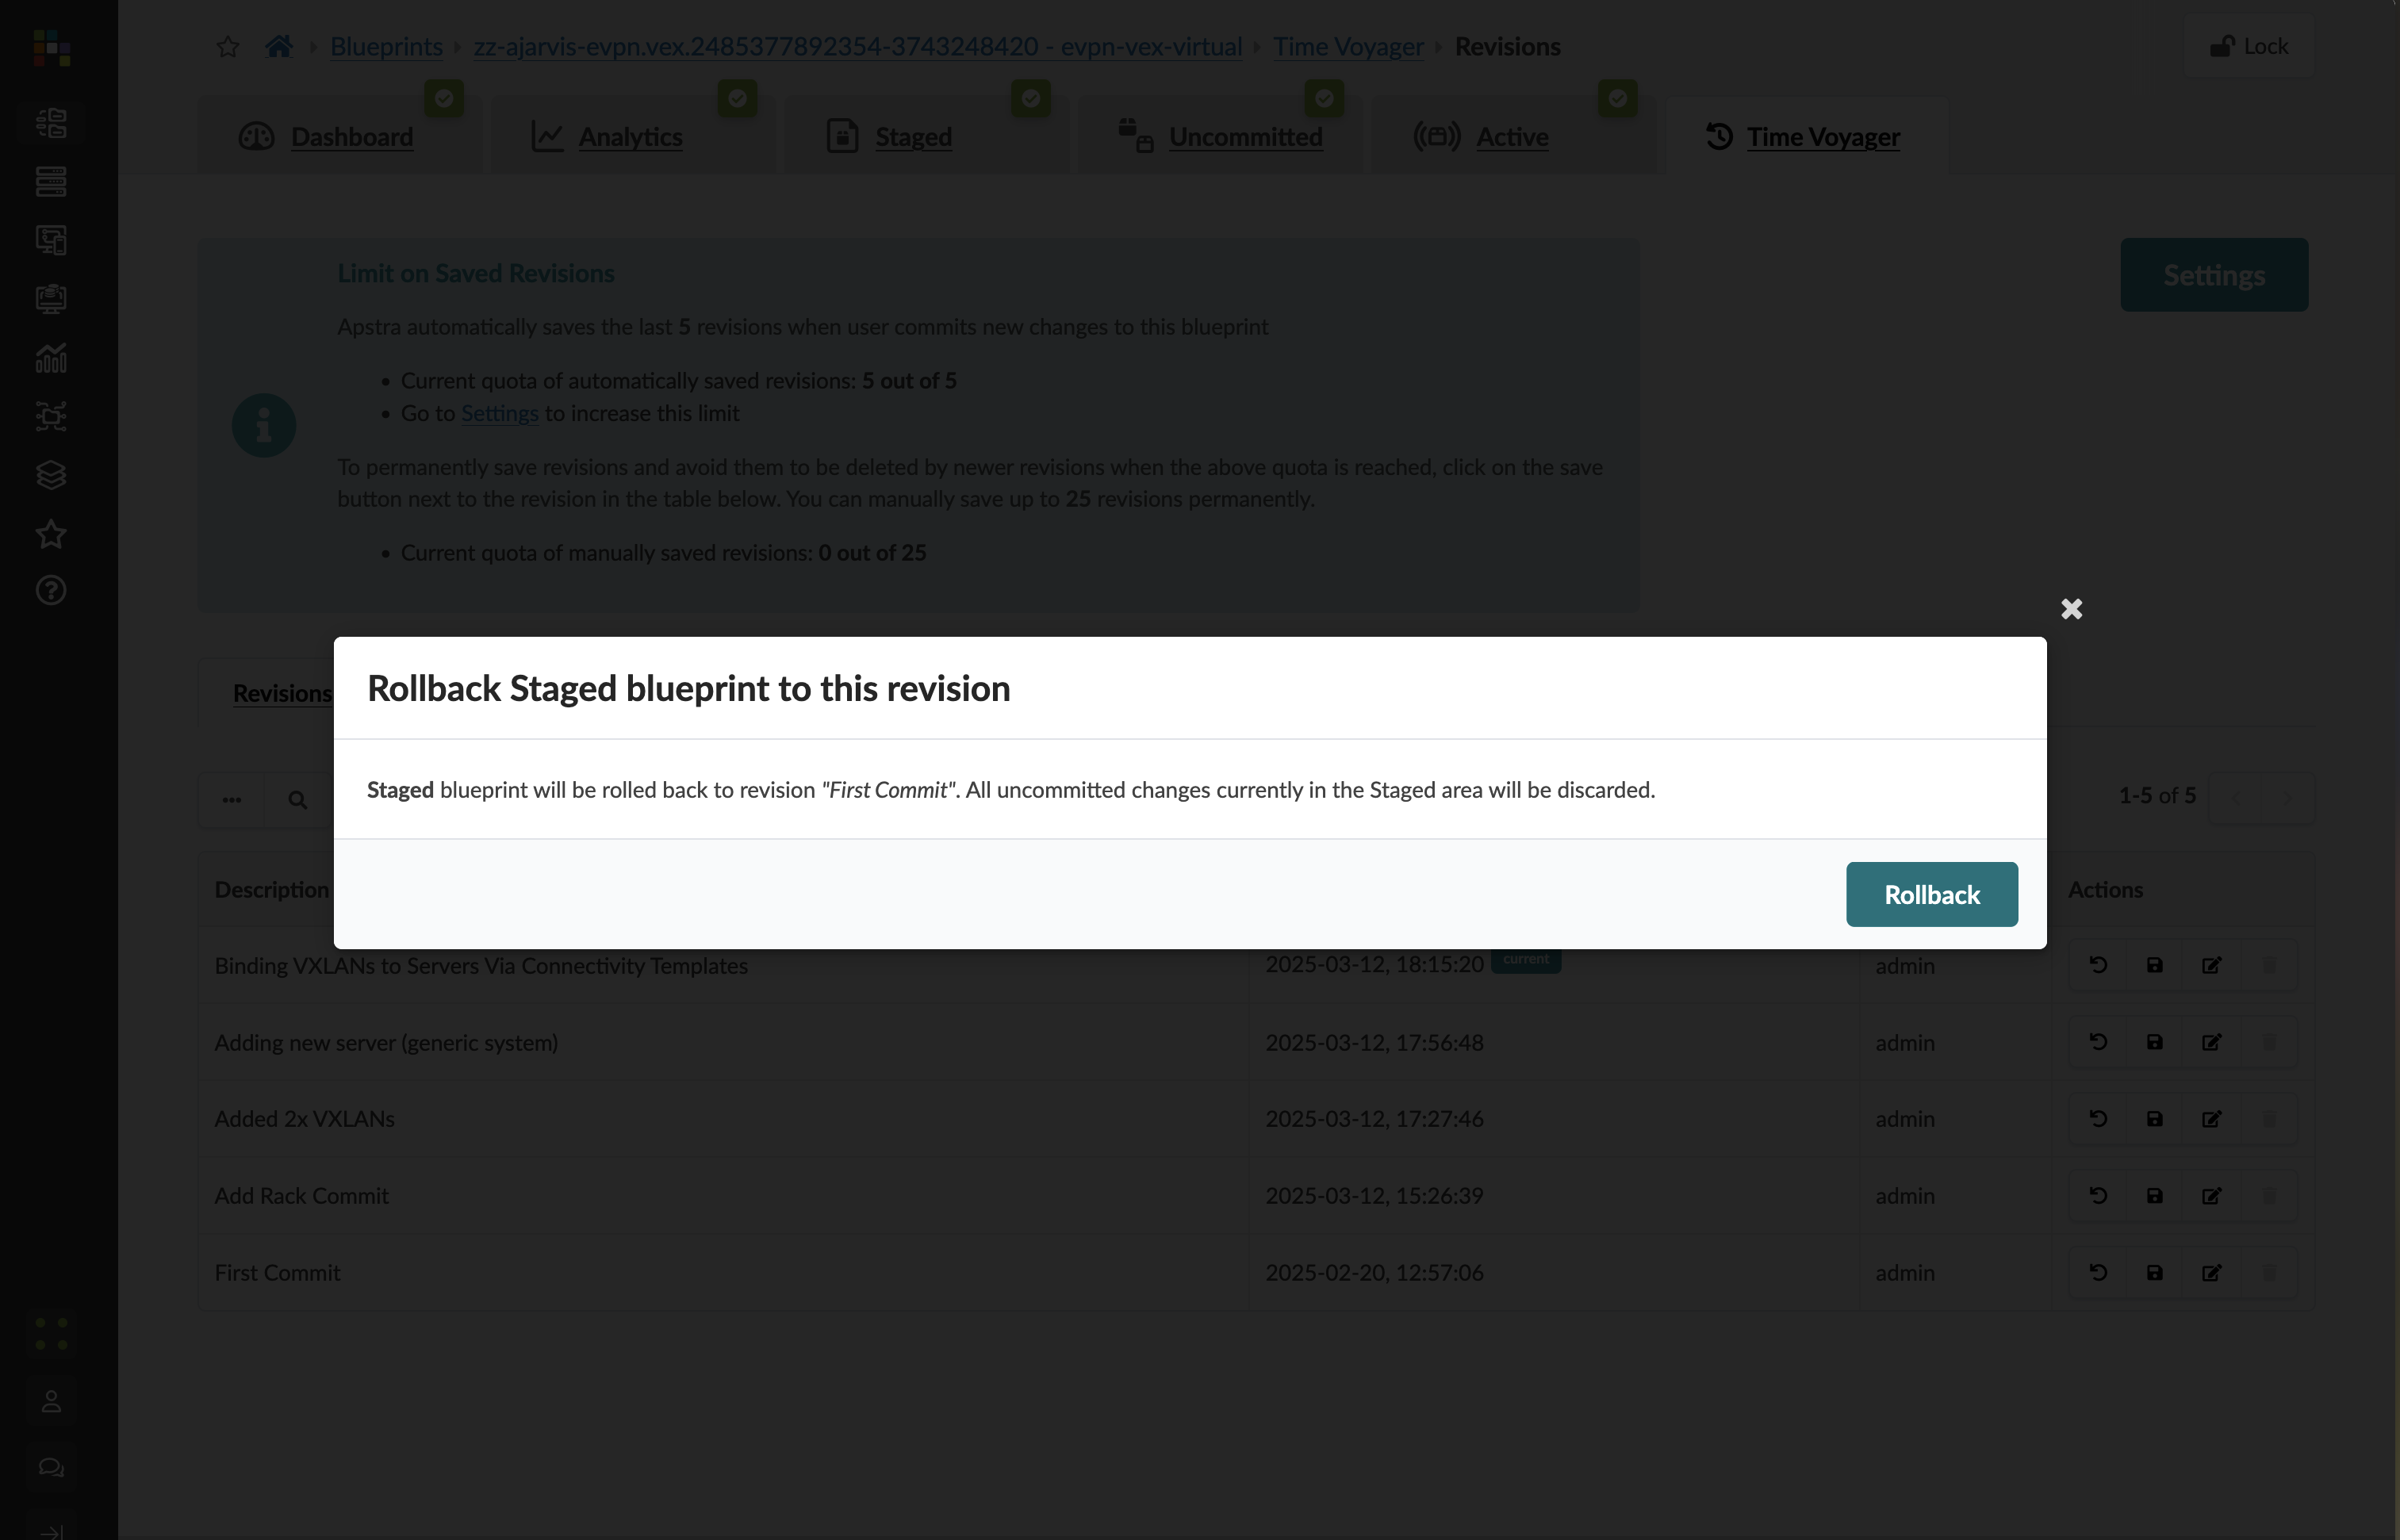
|
This does not immediately change your live network. It loads the earlier state into the staging area so you can review it — and decide whether to proceed — before anything changes. |
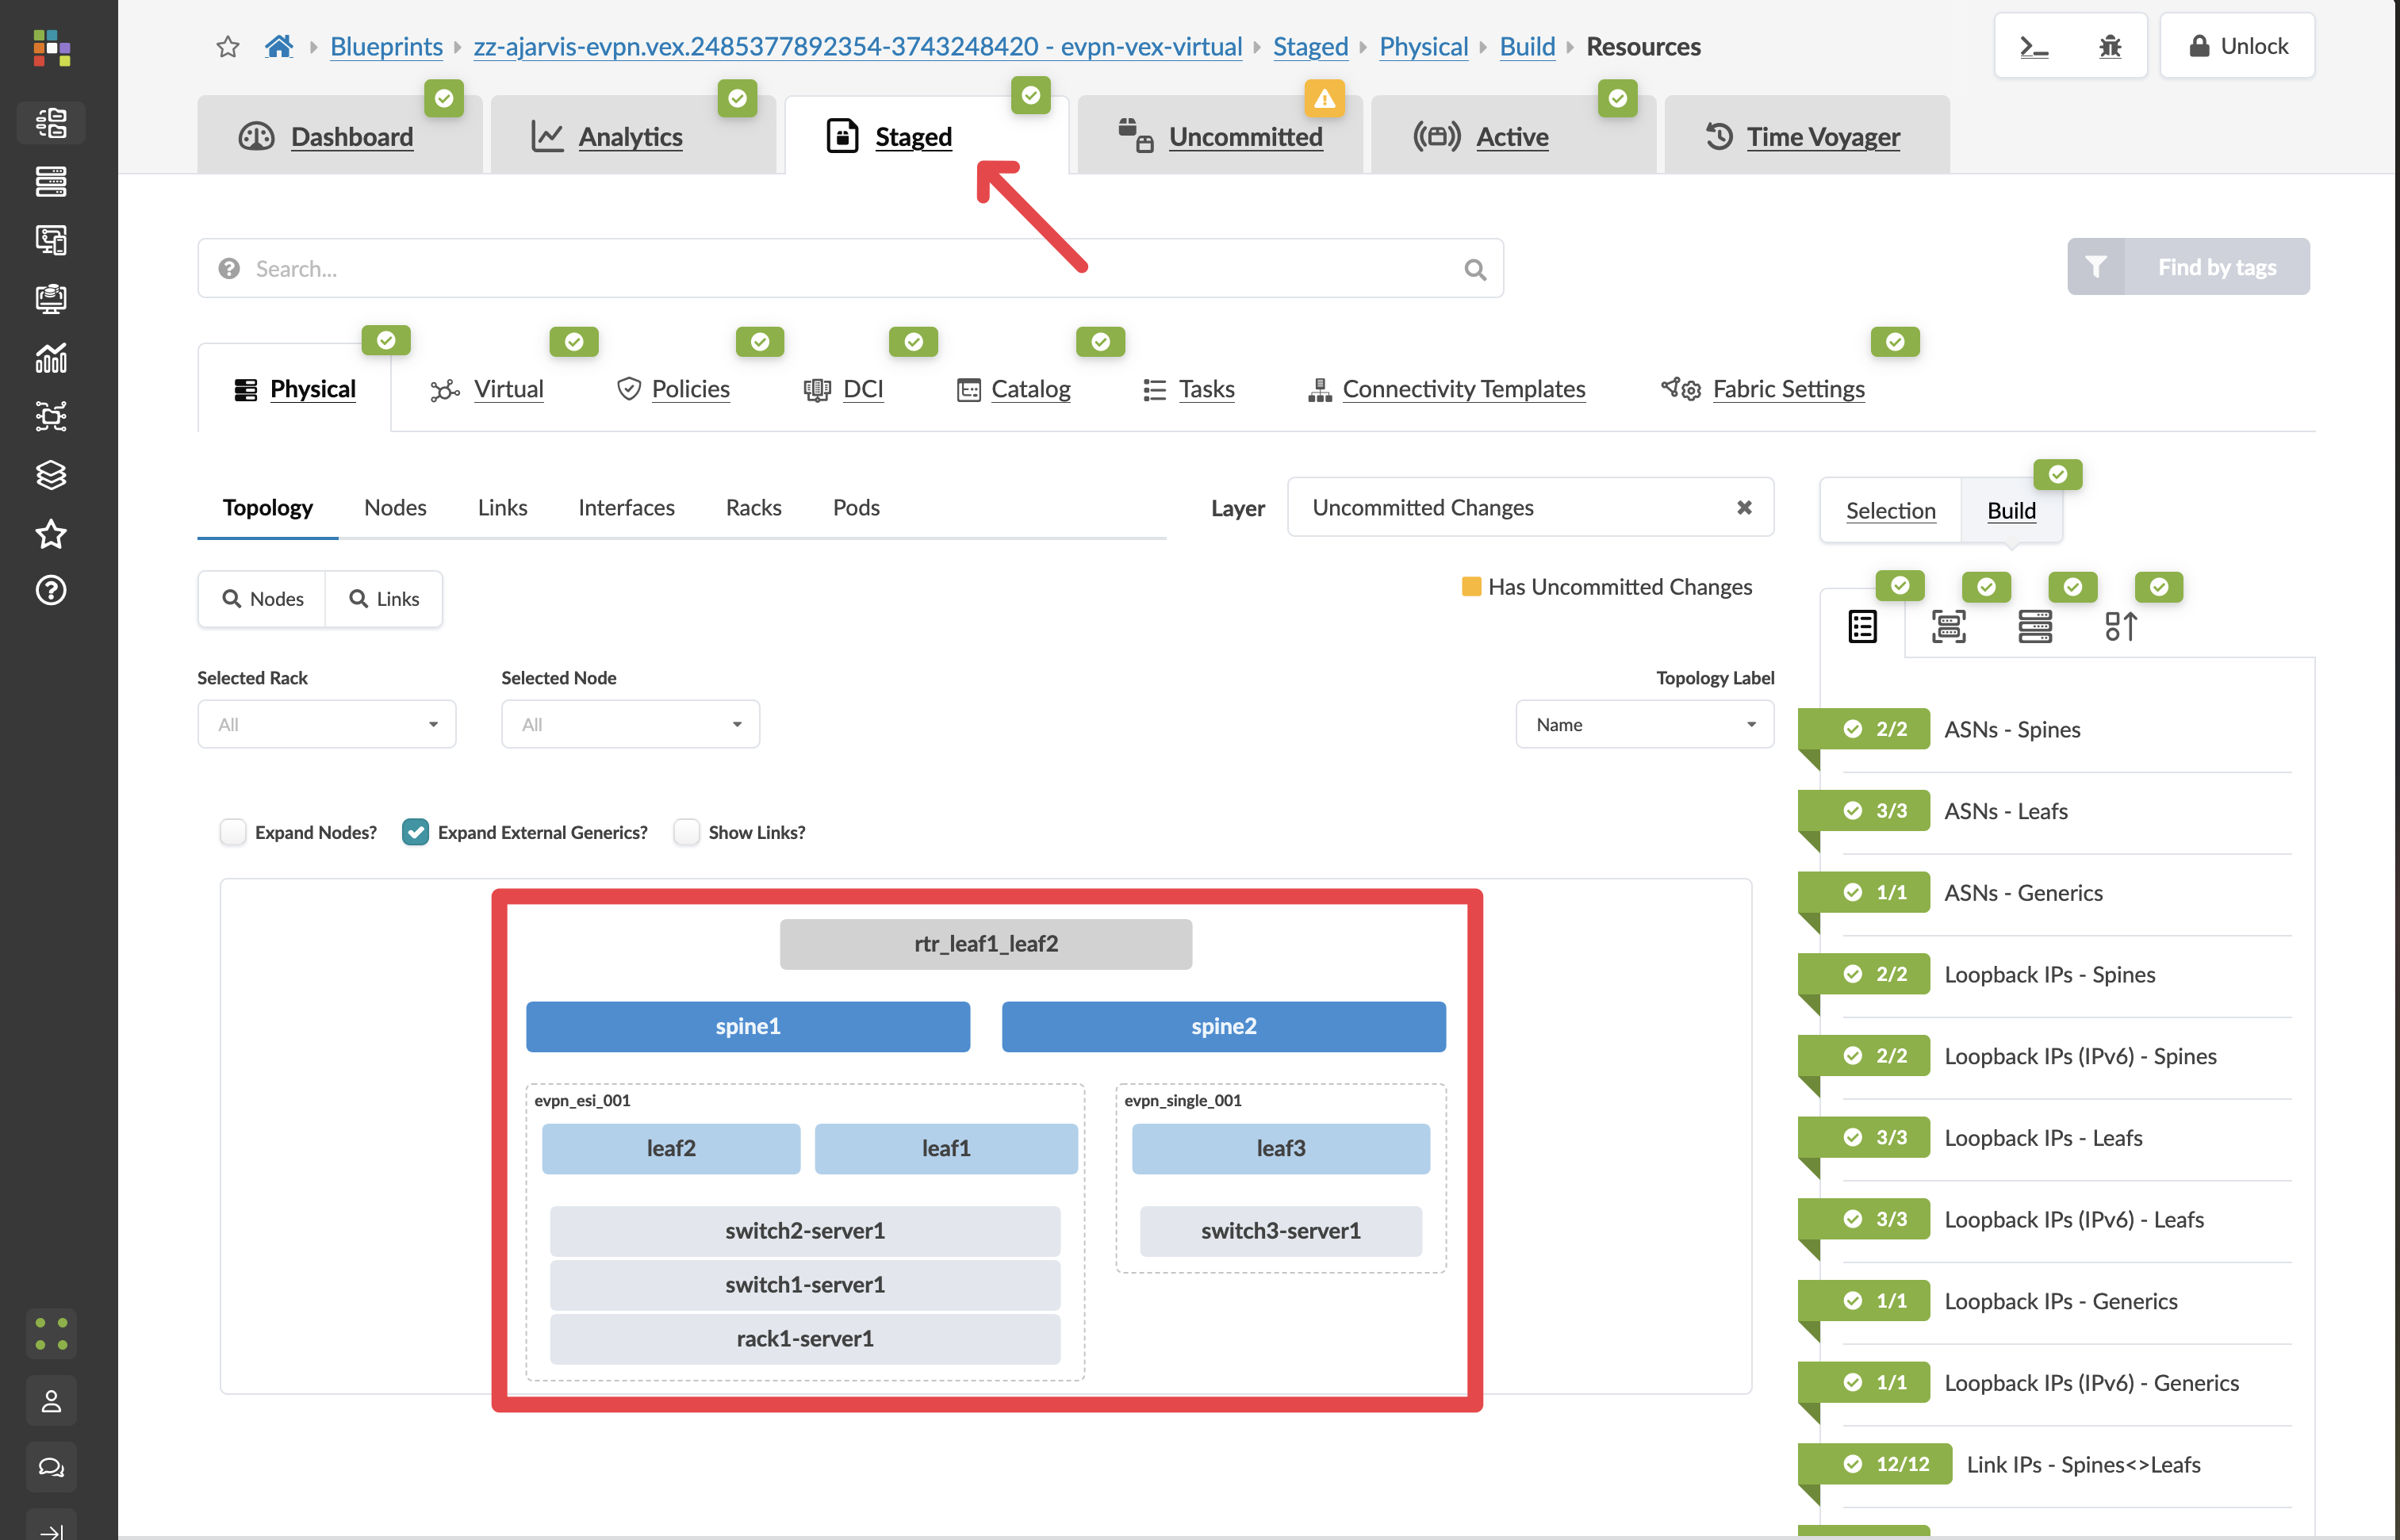
-
Navigate to the Staged tab to see what the network looked like at that earlier point.
-
Click Active to confirm the live network is still running normally.

-
Click Uncommitted to see the exact difference between the earlier state and what is currently active.
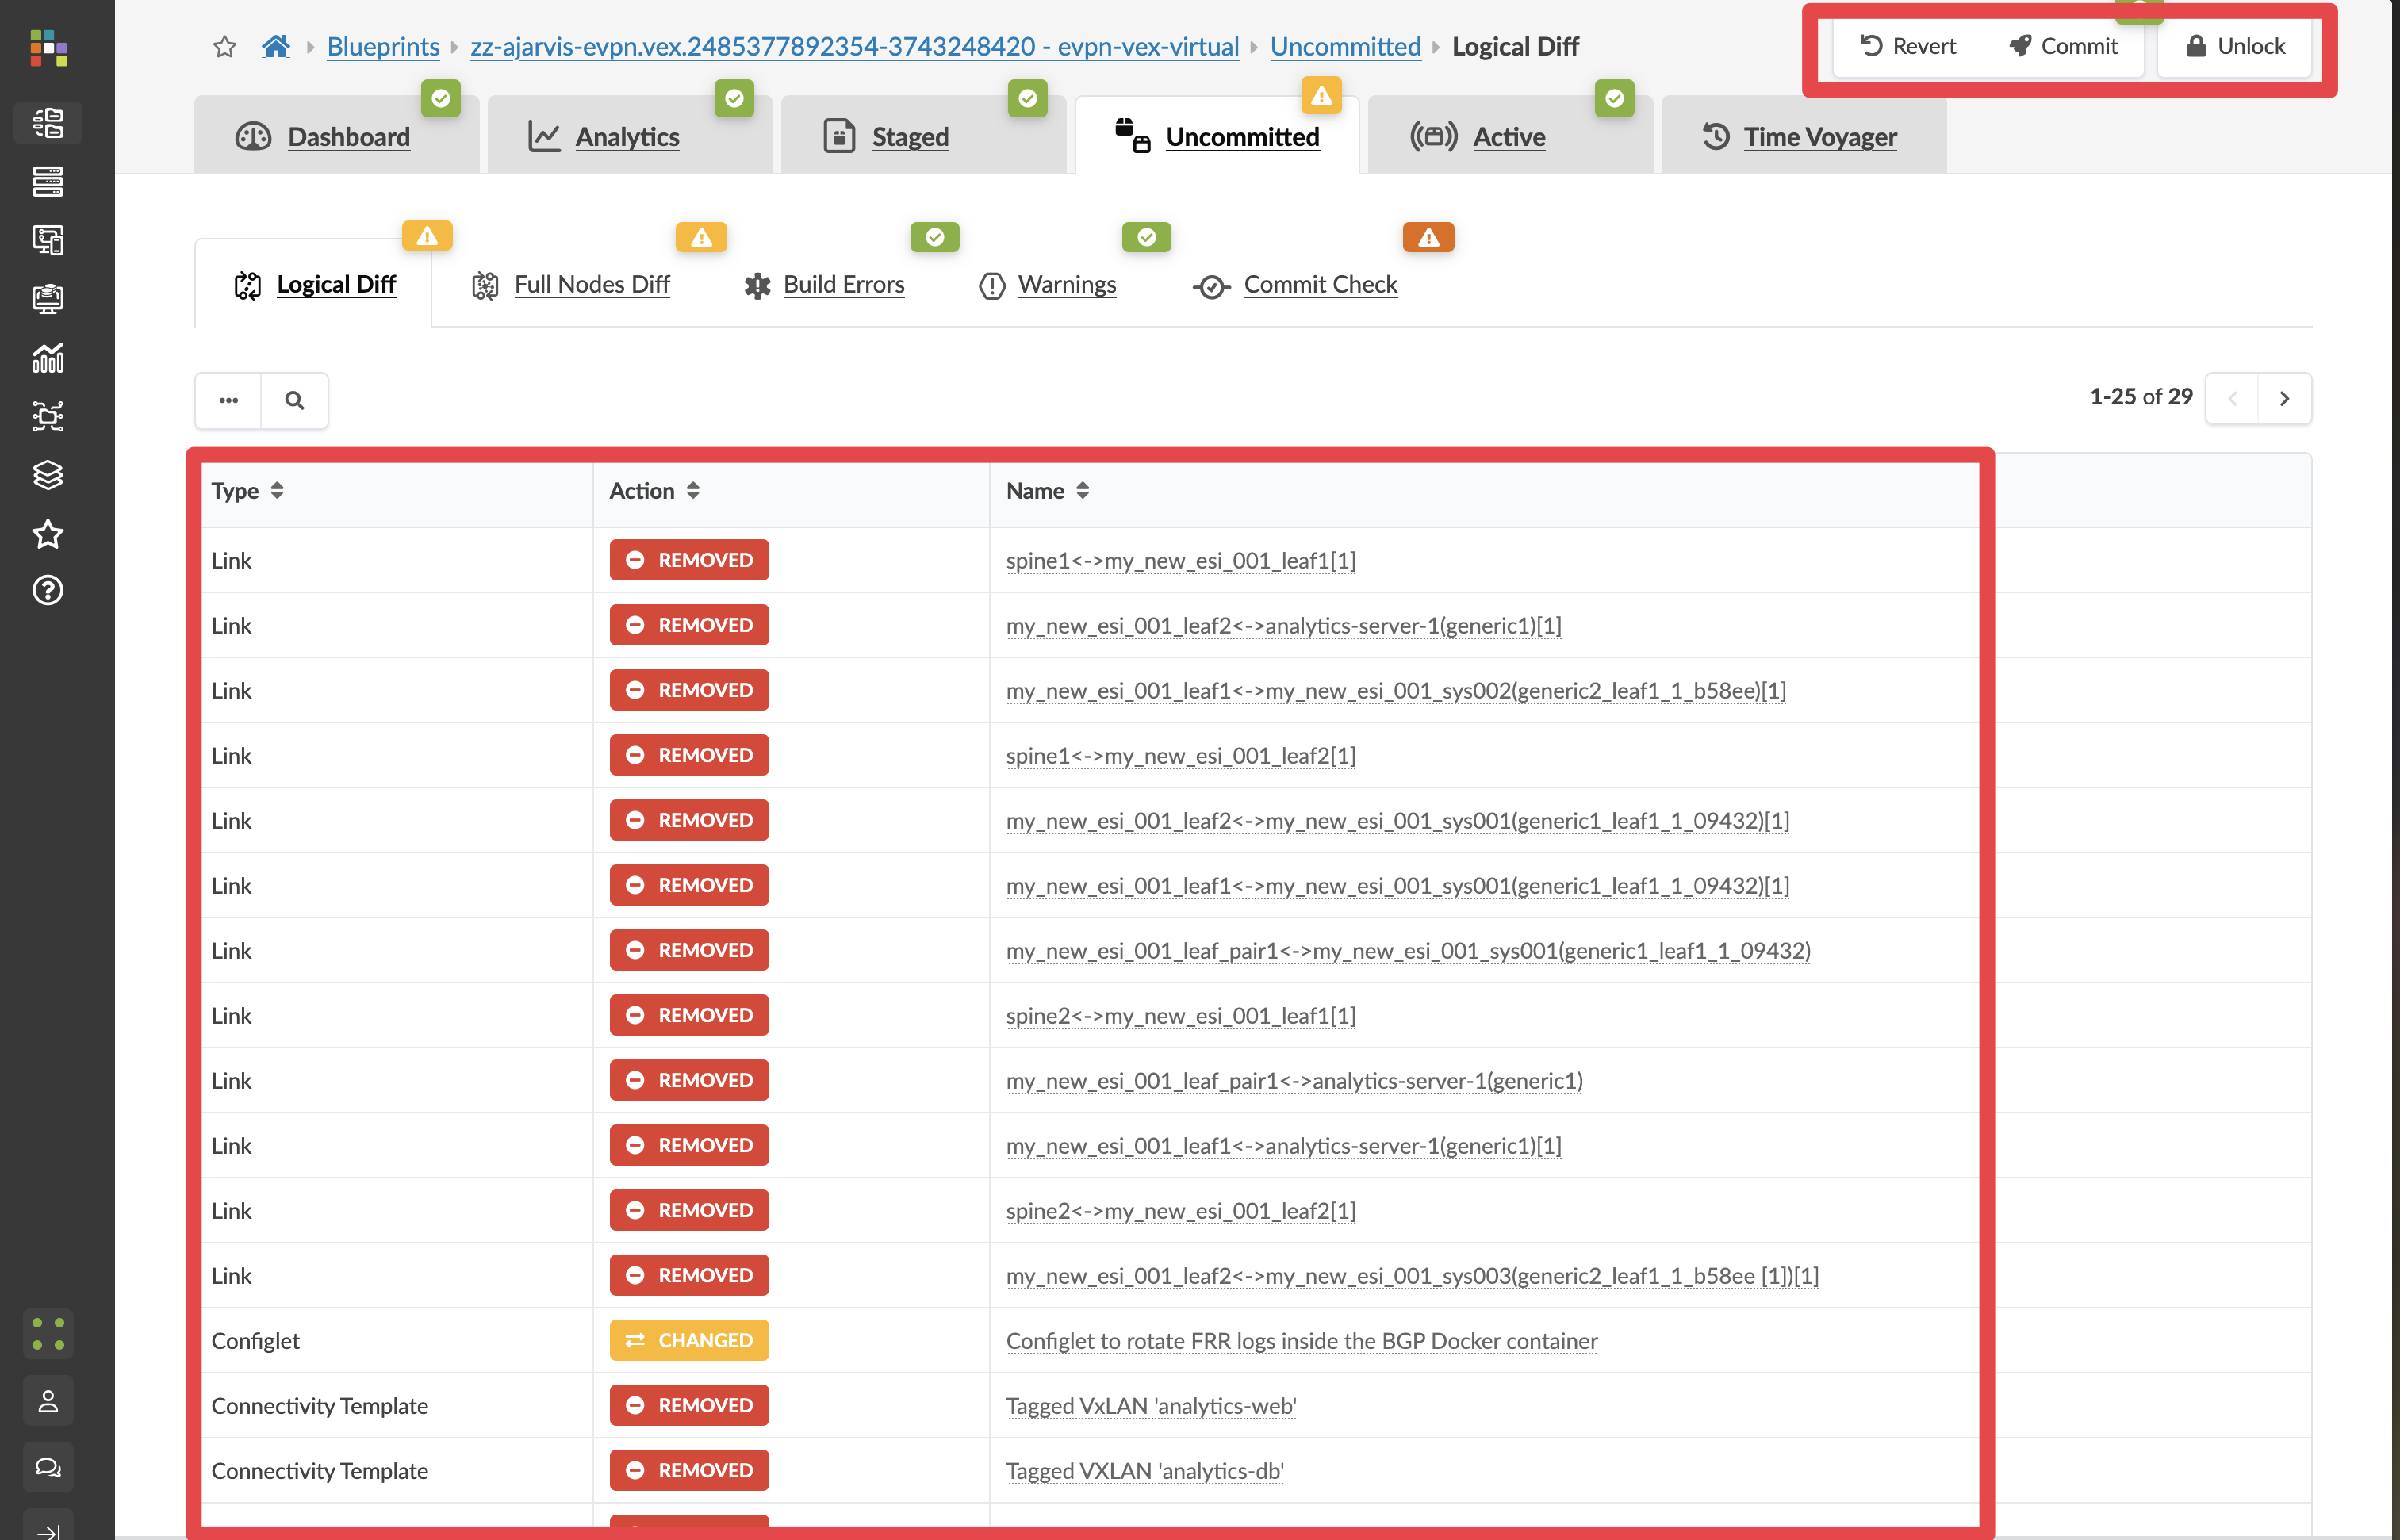
Red items would be removed from the live network. Green items would be restored. This is your complete preview of what a rollback would do — across every device.
-
For this exercise, click Revert to discard the staged rollback. Your live network remains unchanged.
|
In a real incident, you would click Commit at this point. Apstra calculates every change needed across every affected device and pushes them all in the correct order — returning the fabric to a known-good state in one controlled operation, rather than manually undoing changes device by device. |