Lab Guide 1 - Juniper
Predefined IBA Analytics Dashboard
Task: Instantiate a Predefined IBA Analytics Dashboard
Let’s add a bandwidth utilisation Analytics Dashboard to monitor traffic on our new Analytics rack:
-
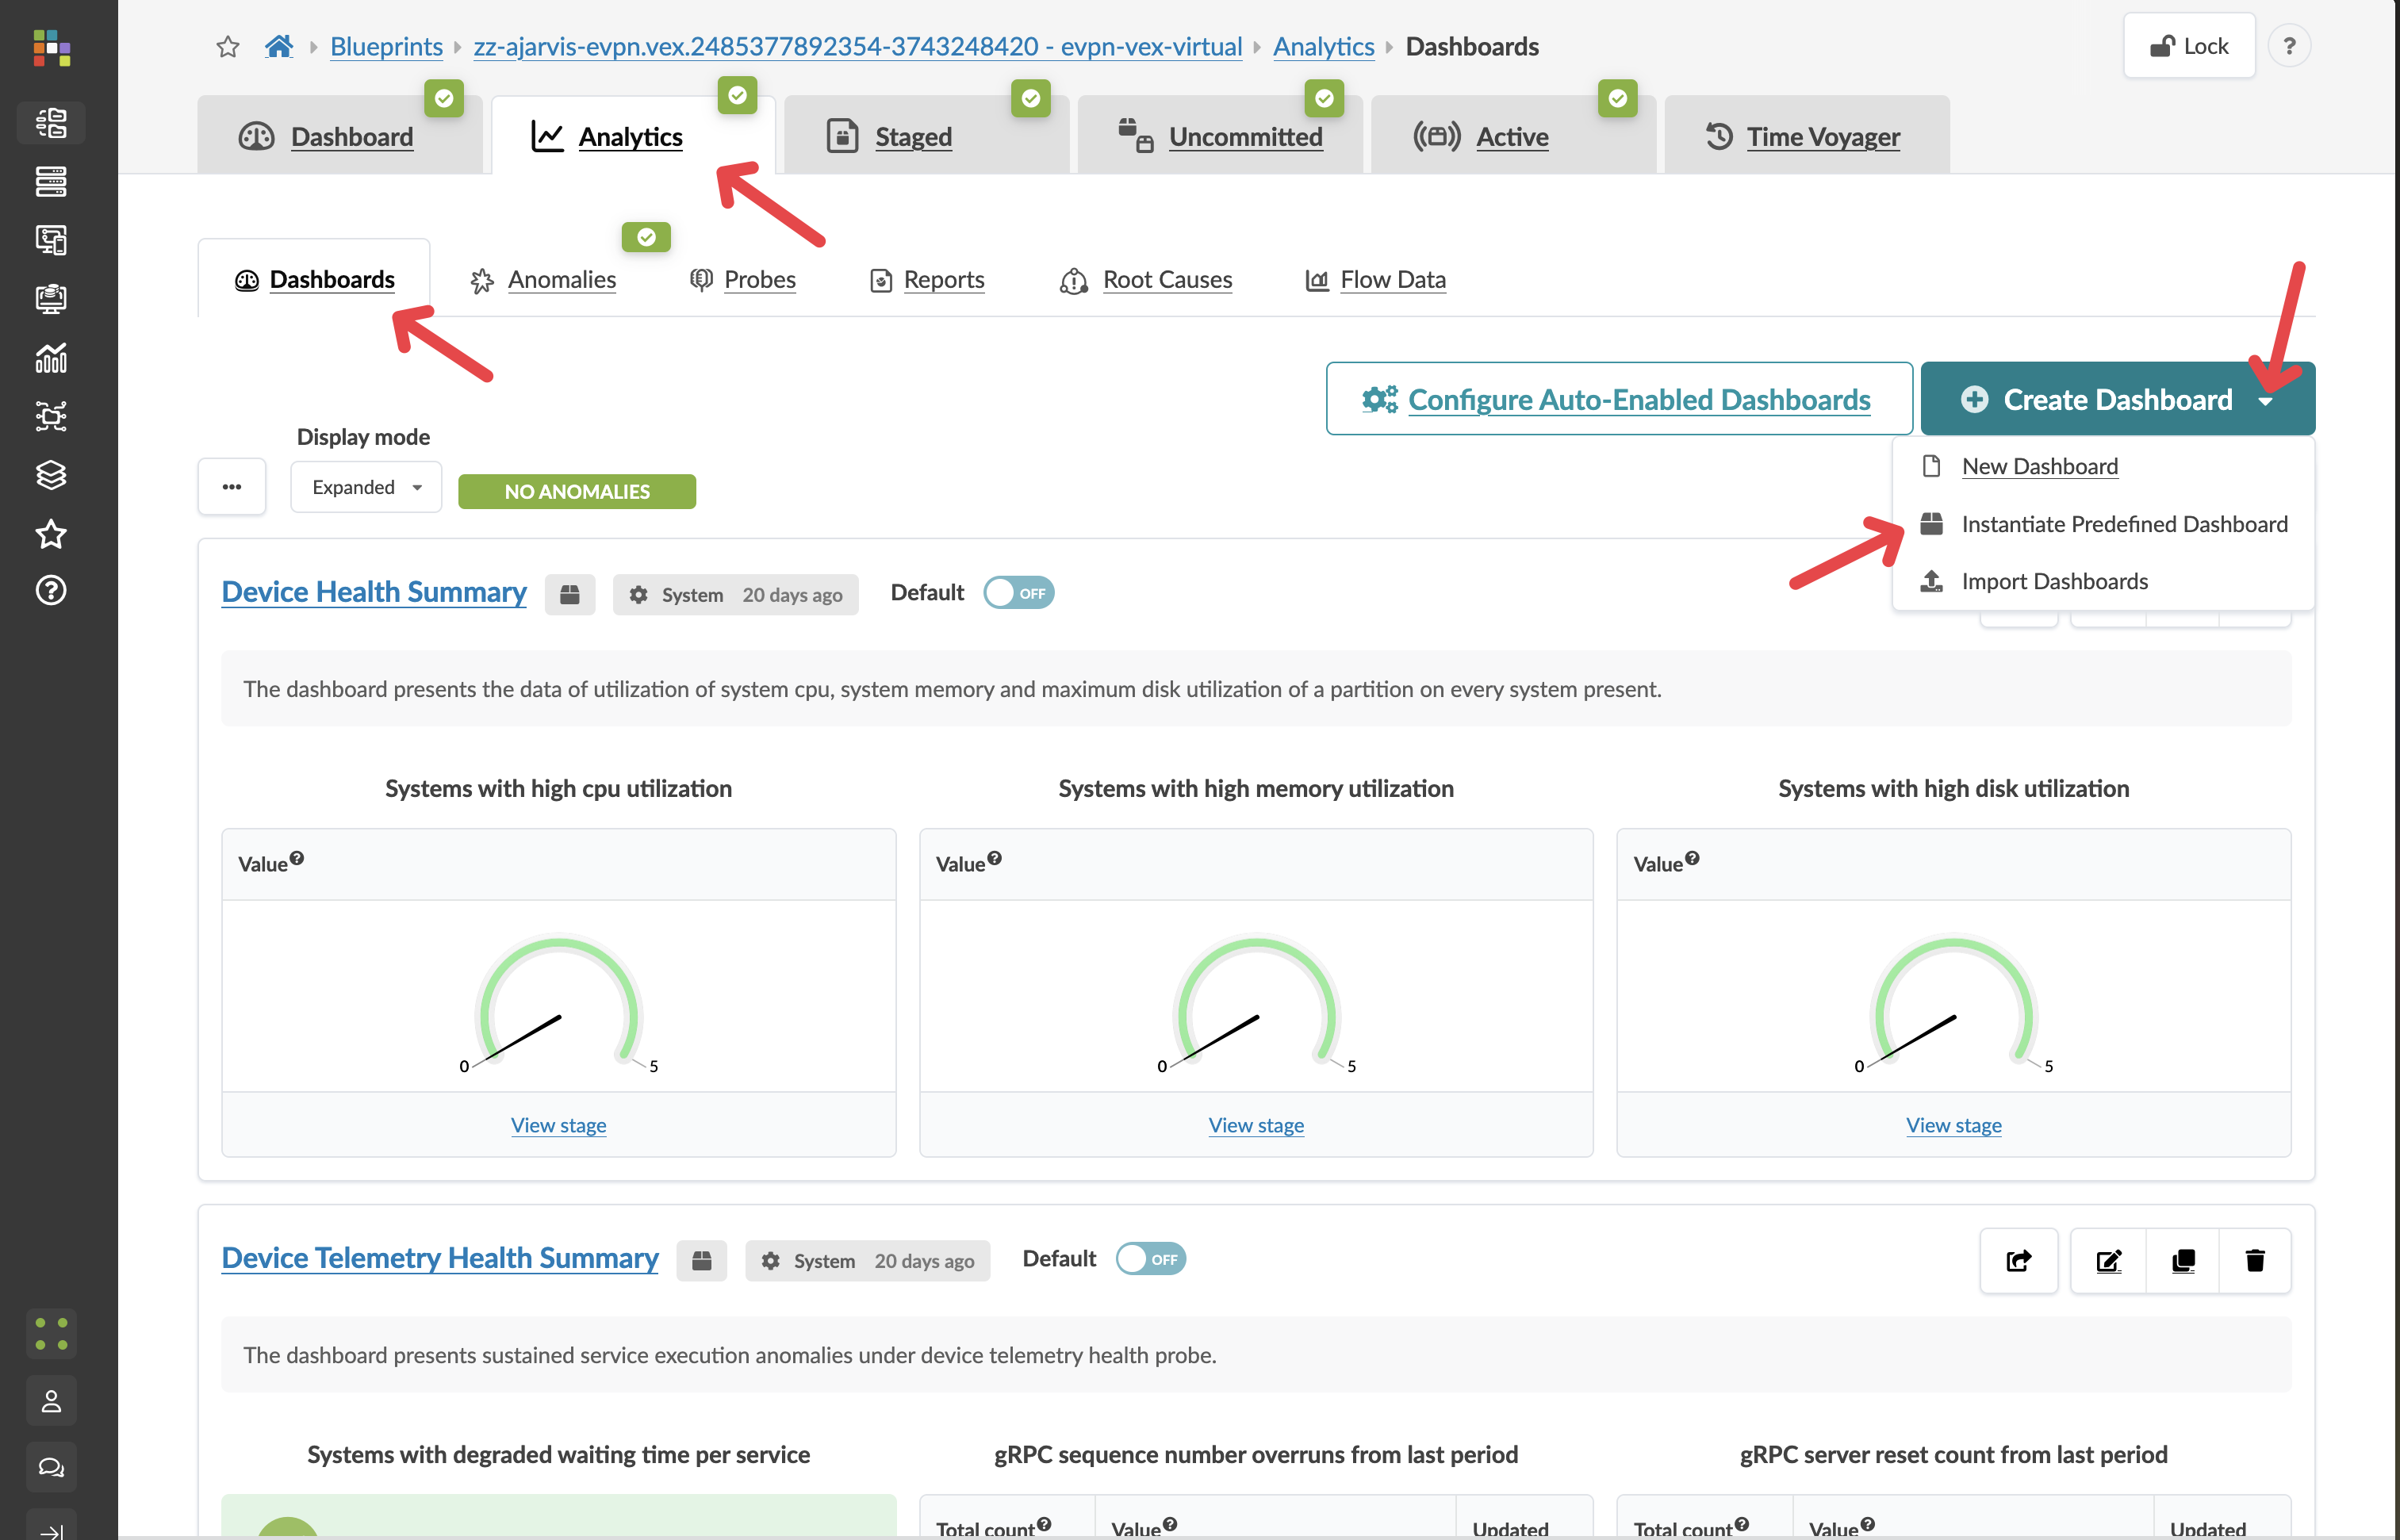
From the blueprint, navigate to
-
Click Create Dashboard and select Instantiate Predefined Dashboard
-
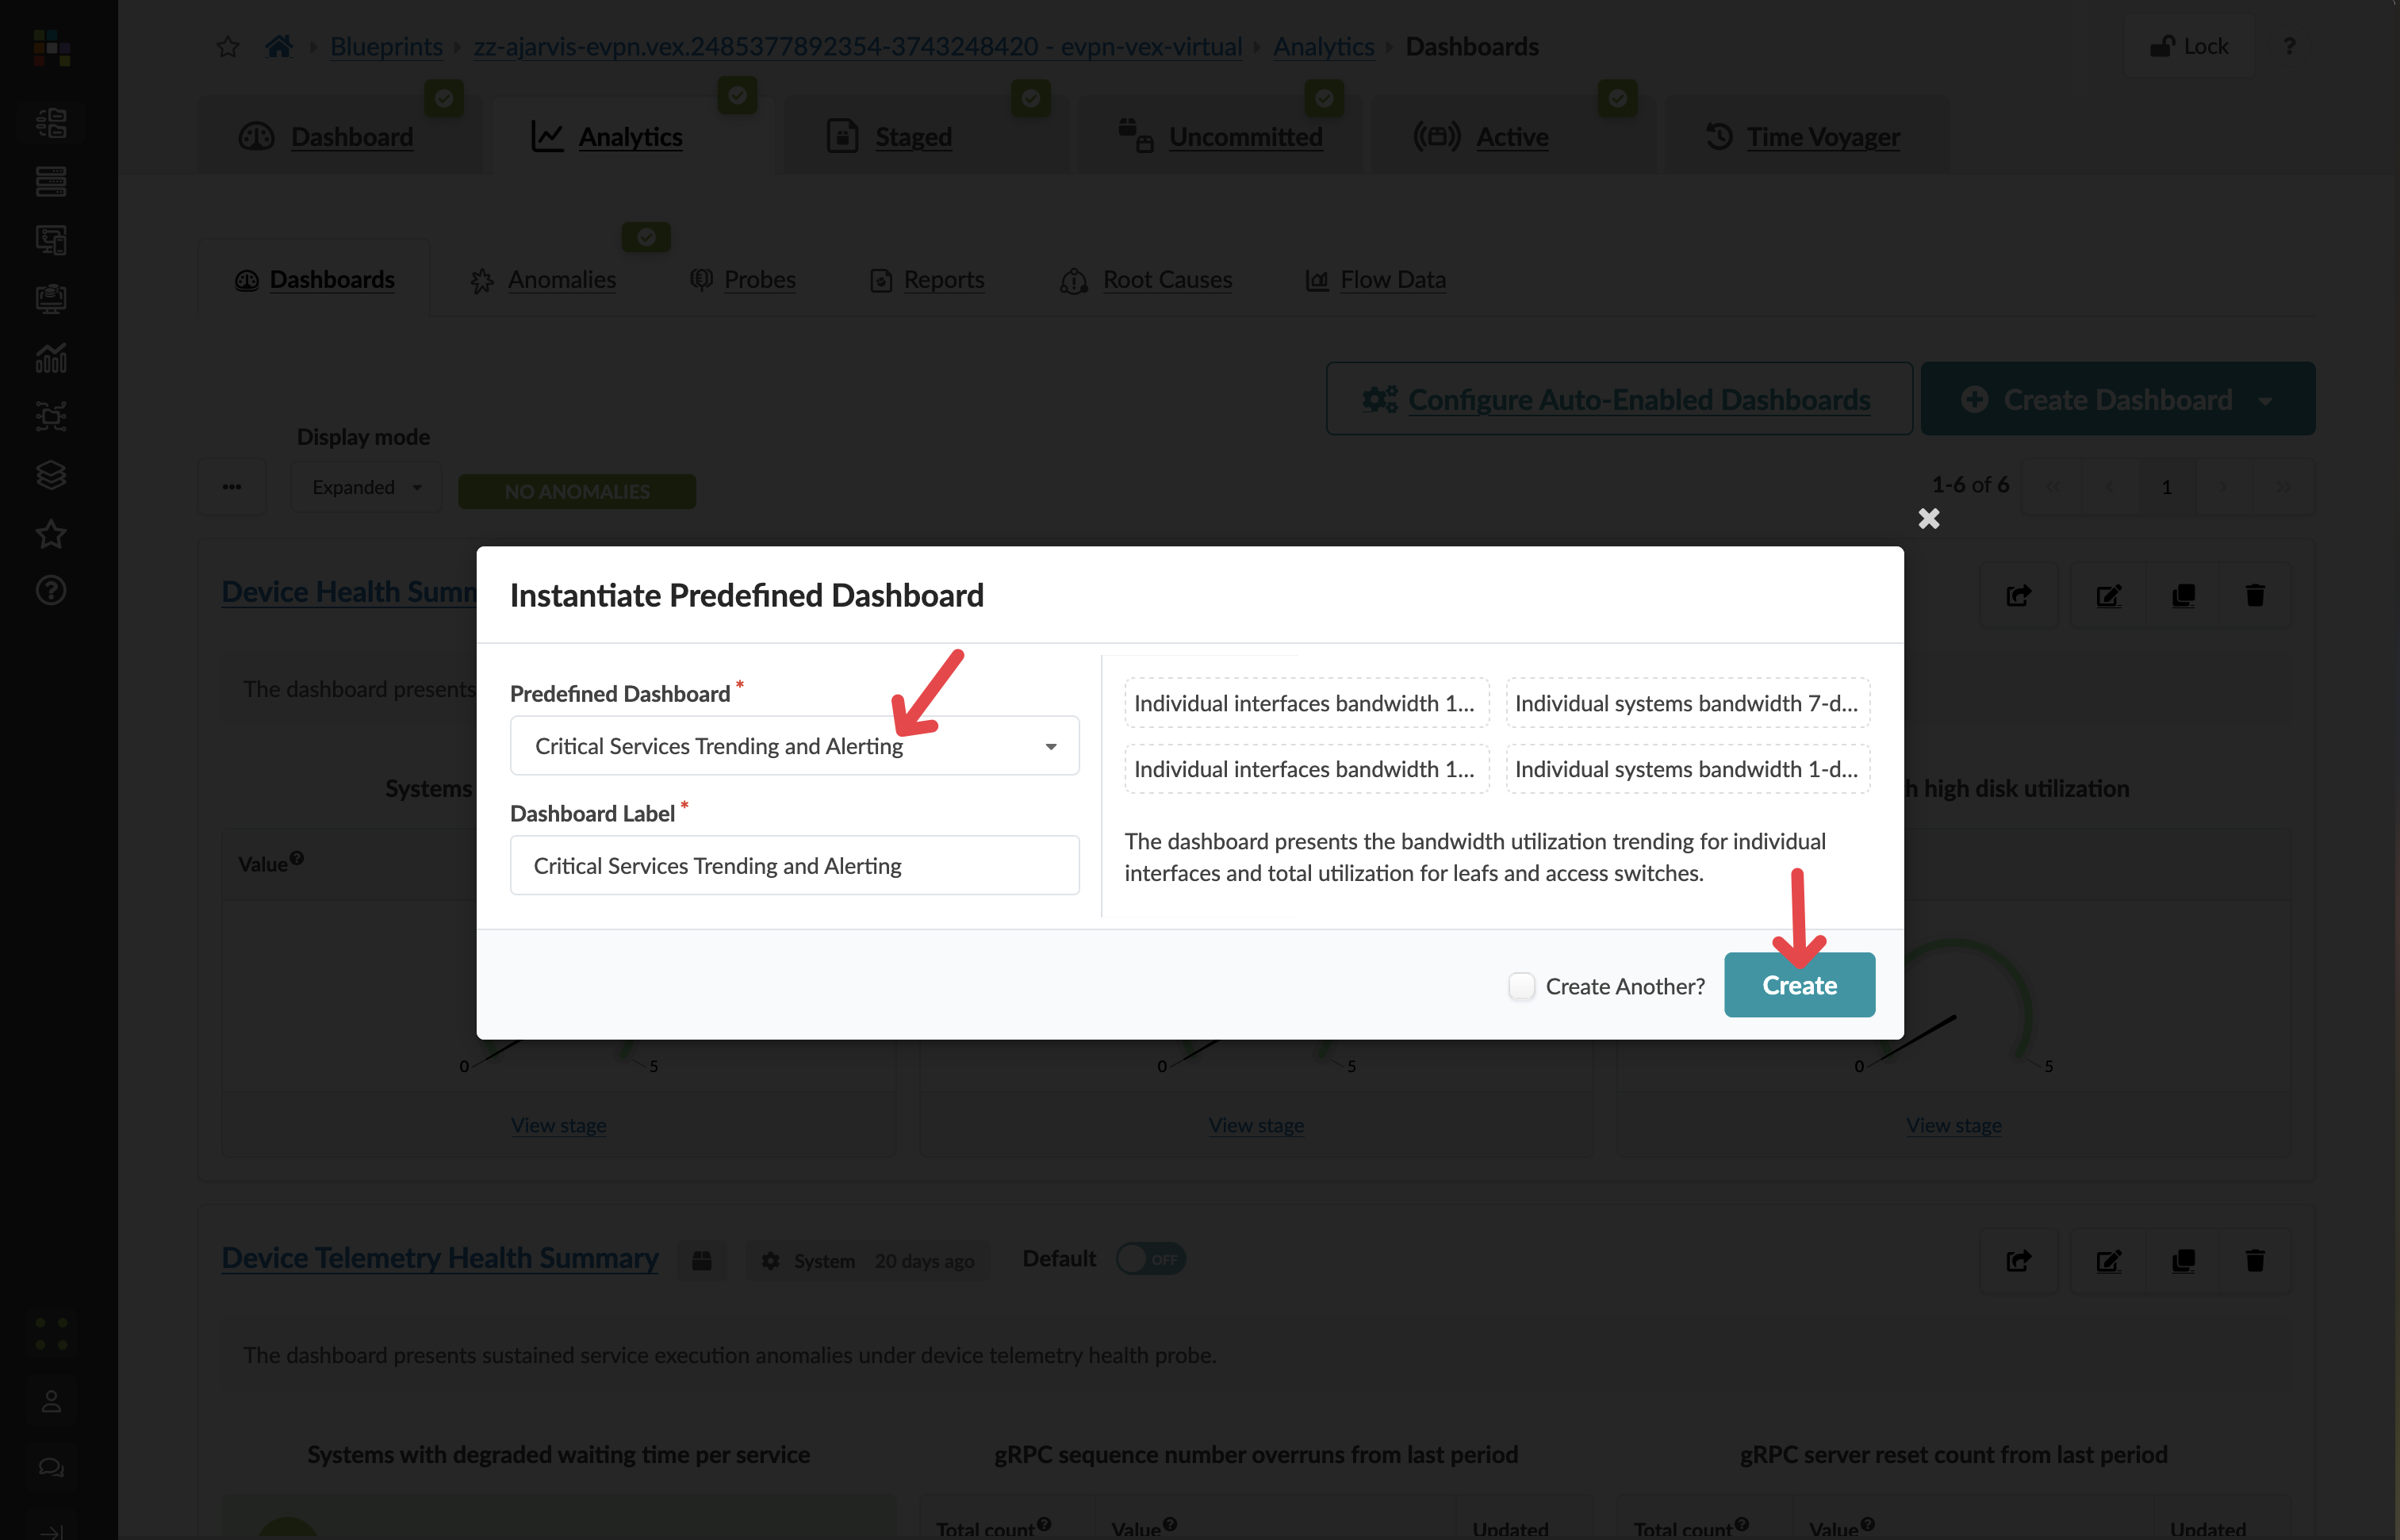
Configure the Analytics Dashboard with these settings:
Parameter Value Predefined Analytics Dashboard
Critical Services Trending and Alerting
Analytics Dashboard Label
Critical Services Trending and Alerting
-
Click Create to instantiate the Analytics Dashboard
-
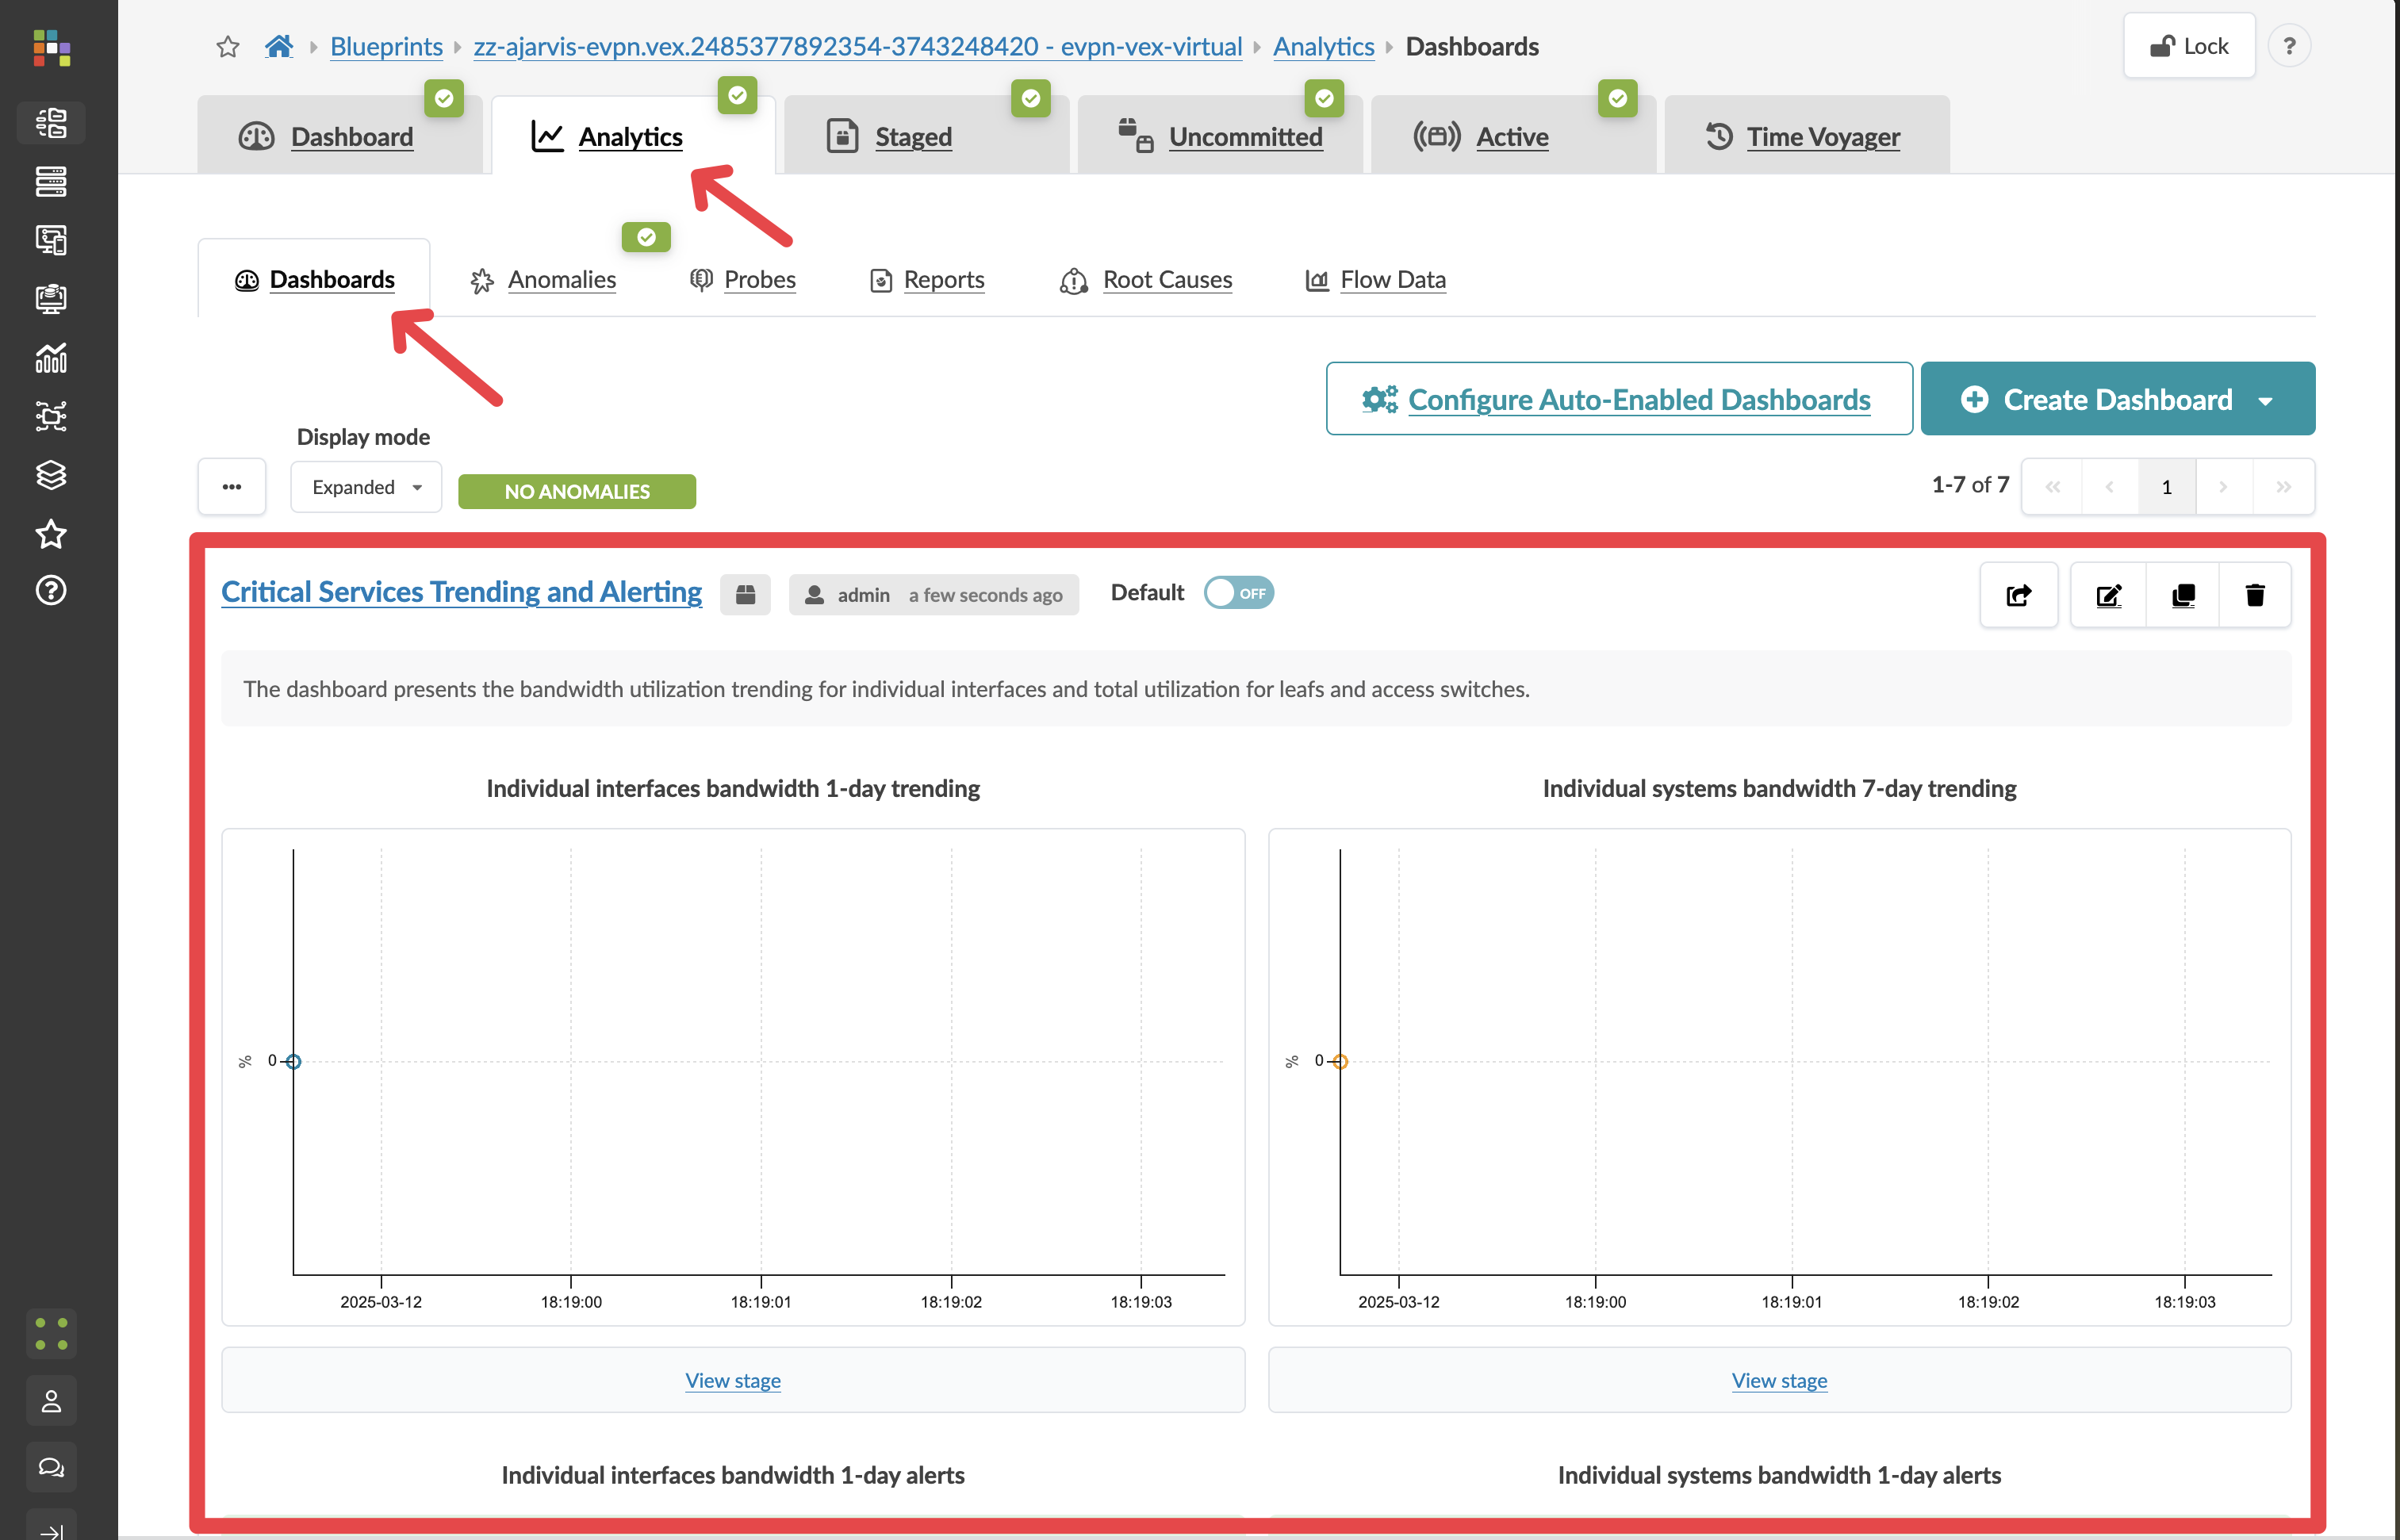
The Analytics Dashboard will immediately begin collecting data and monitoring interface utilisation across your fabric
Understanding Analytics Dashboard Operations
When you create a Analytics Dashboard, several things happen:
-
Apstra automatically identifies all the relevant components in your fabric that the Analytics Dashboard should monitor
-
The system begins collecting telemetry data from these components
-
The data is continuously evaluated against the thresholds you’ve set
-
If any anomalies are detected, an anomaly is created and displayed
-
As your network evolves (adding racks, servers, etc.), the Analytics Dashboard automatically adjusts to monitor the new components - no reconfiguration needed
You can see the data behind the dashboards by clicking on the stage.
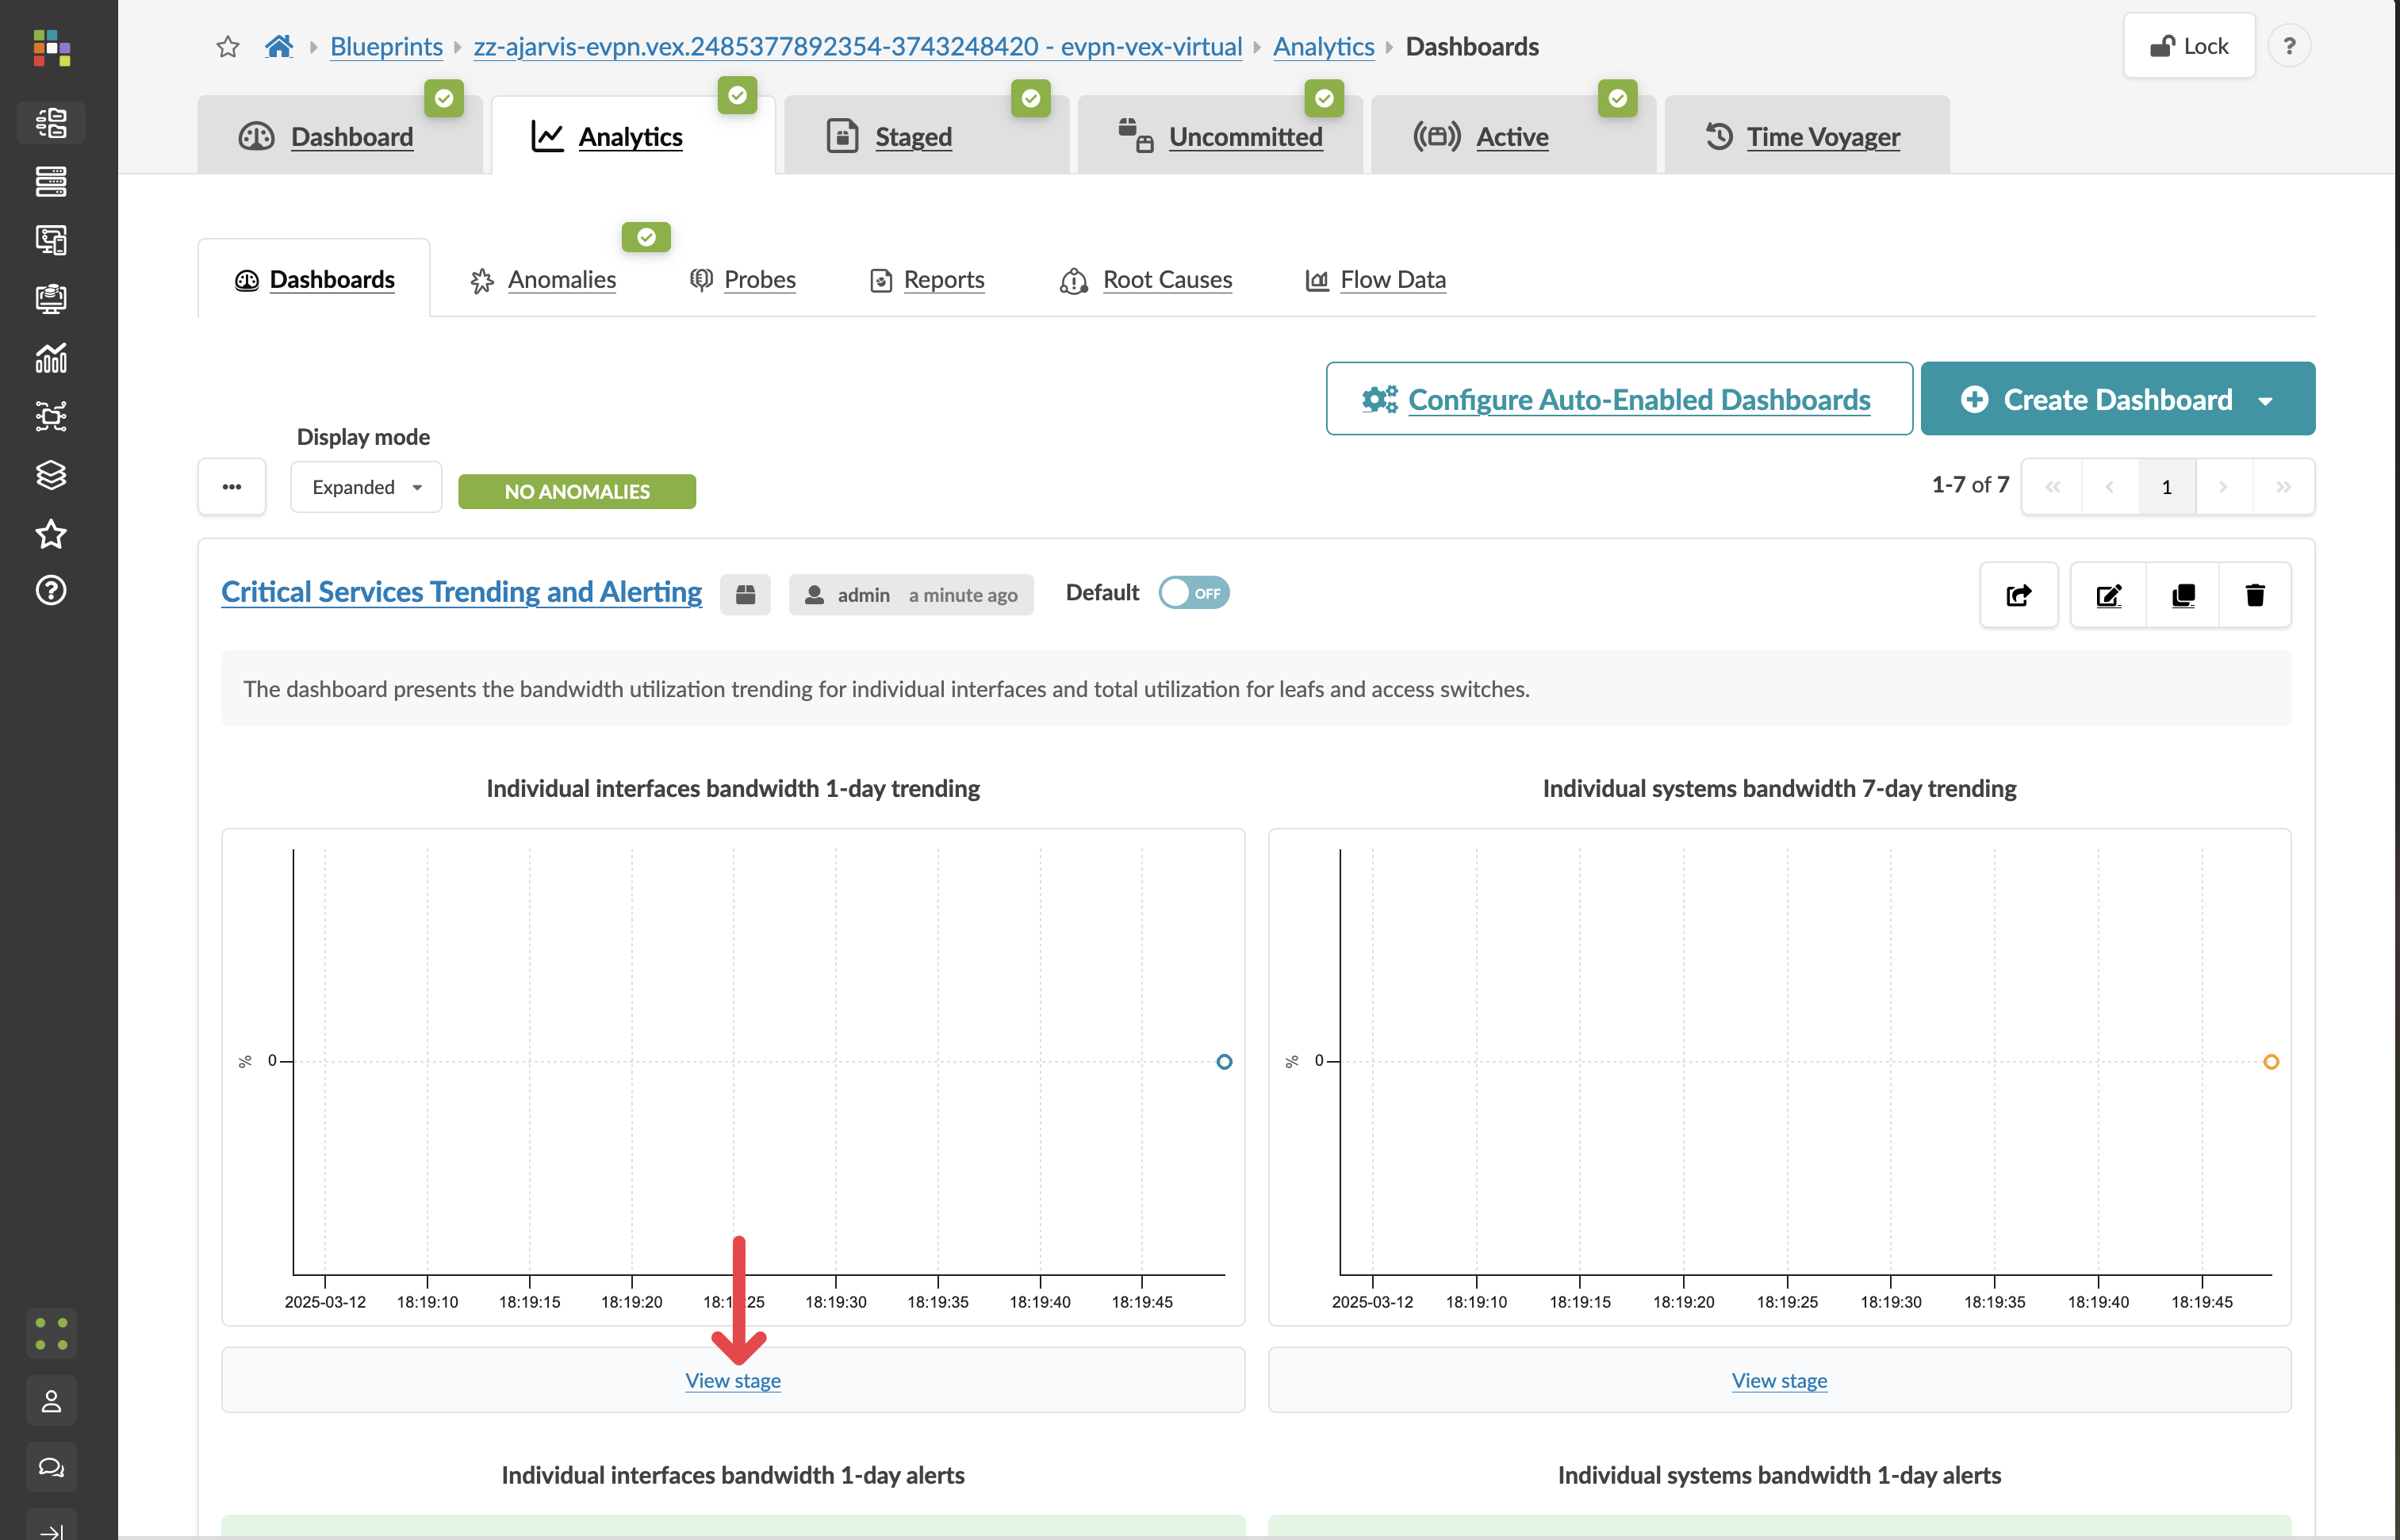
This takes you into what we call probes and these probes show how the data is collected, analysed, and alerts are set up which can be fully customised for your own needs.
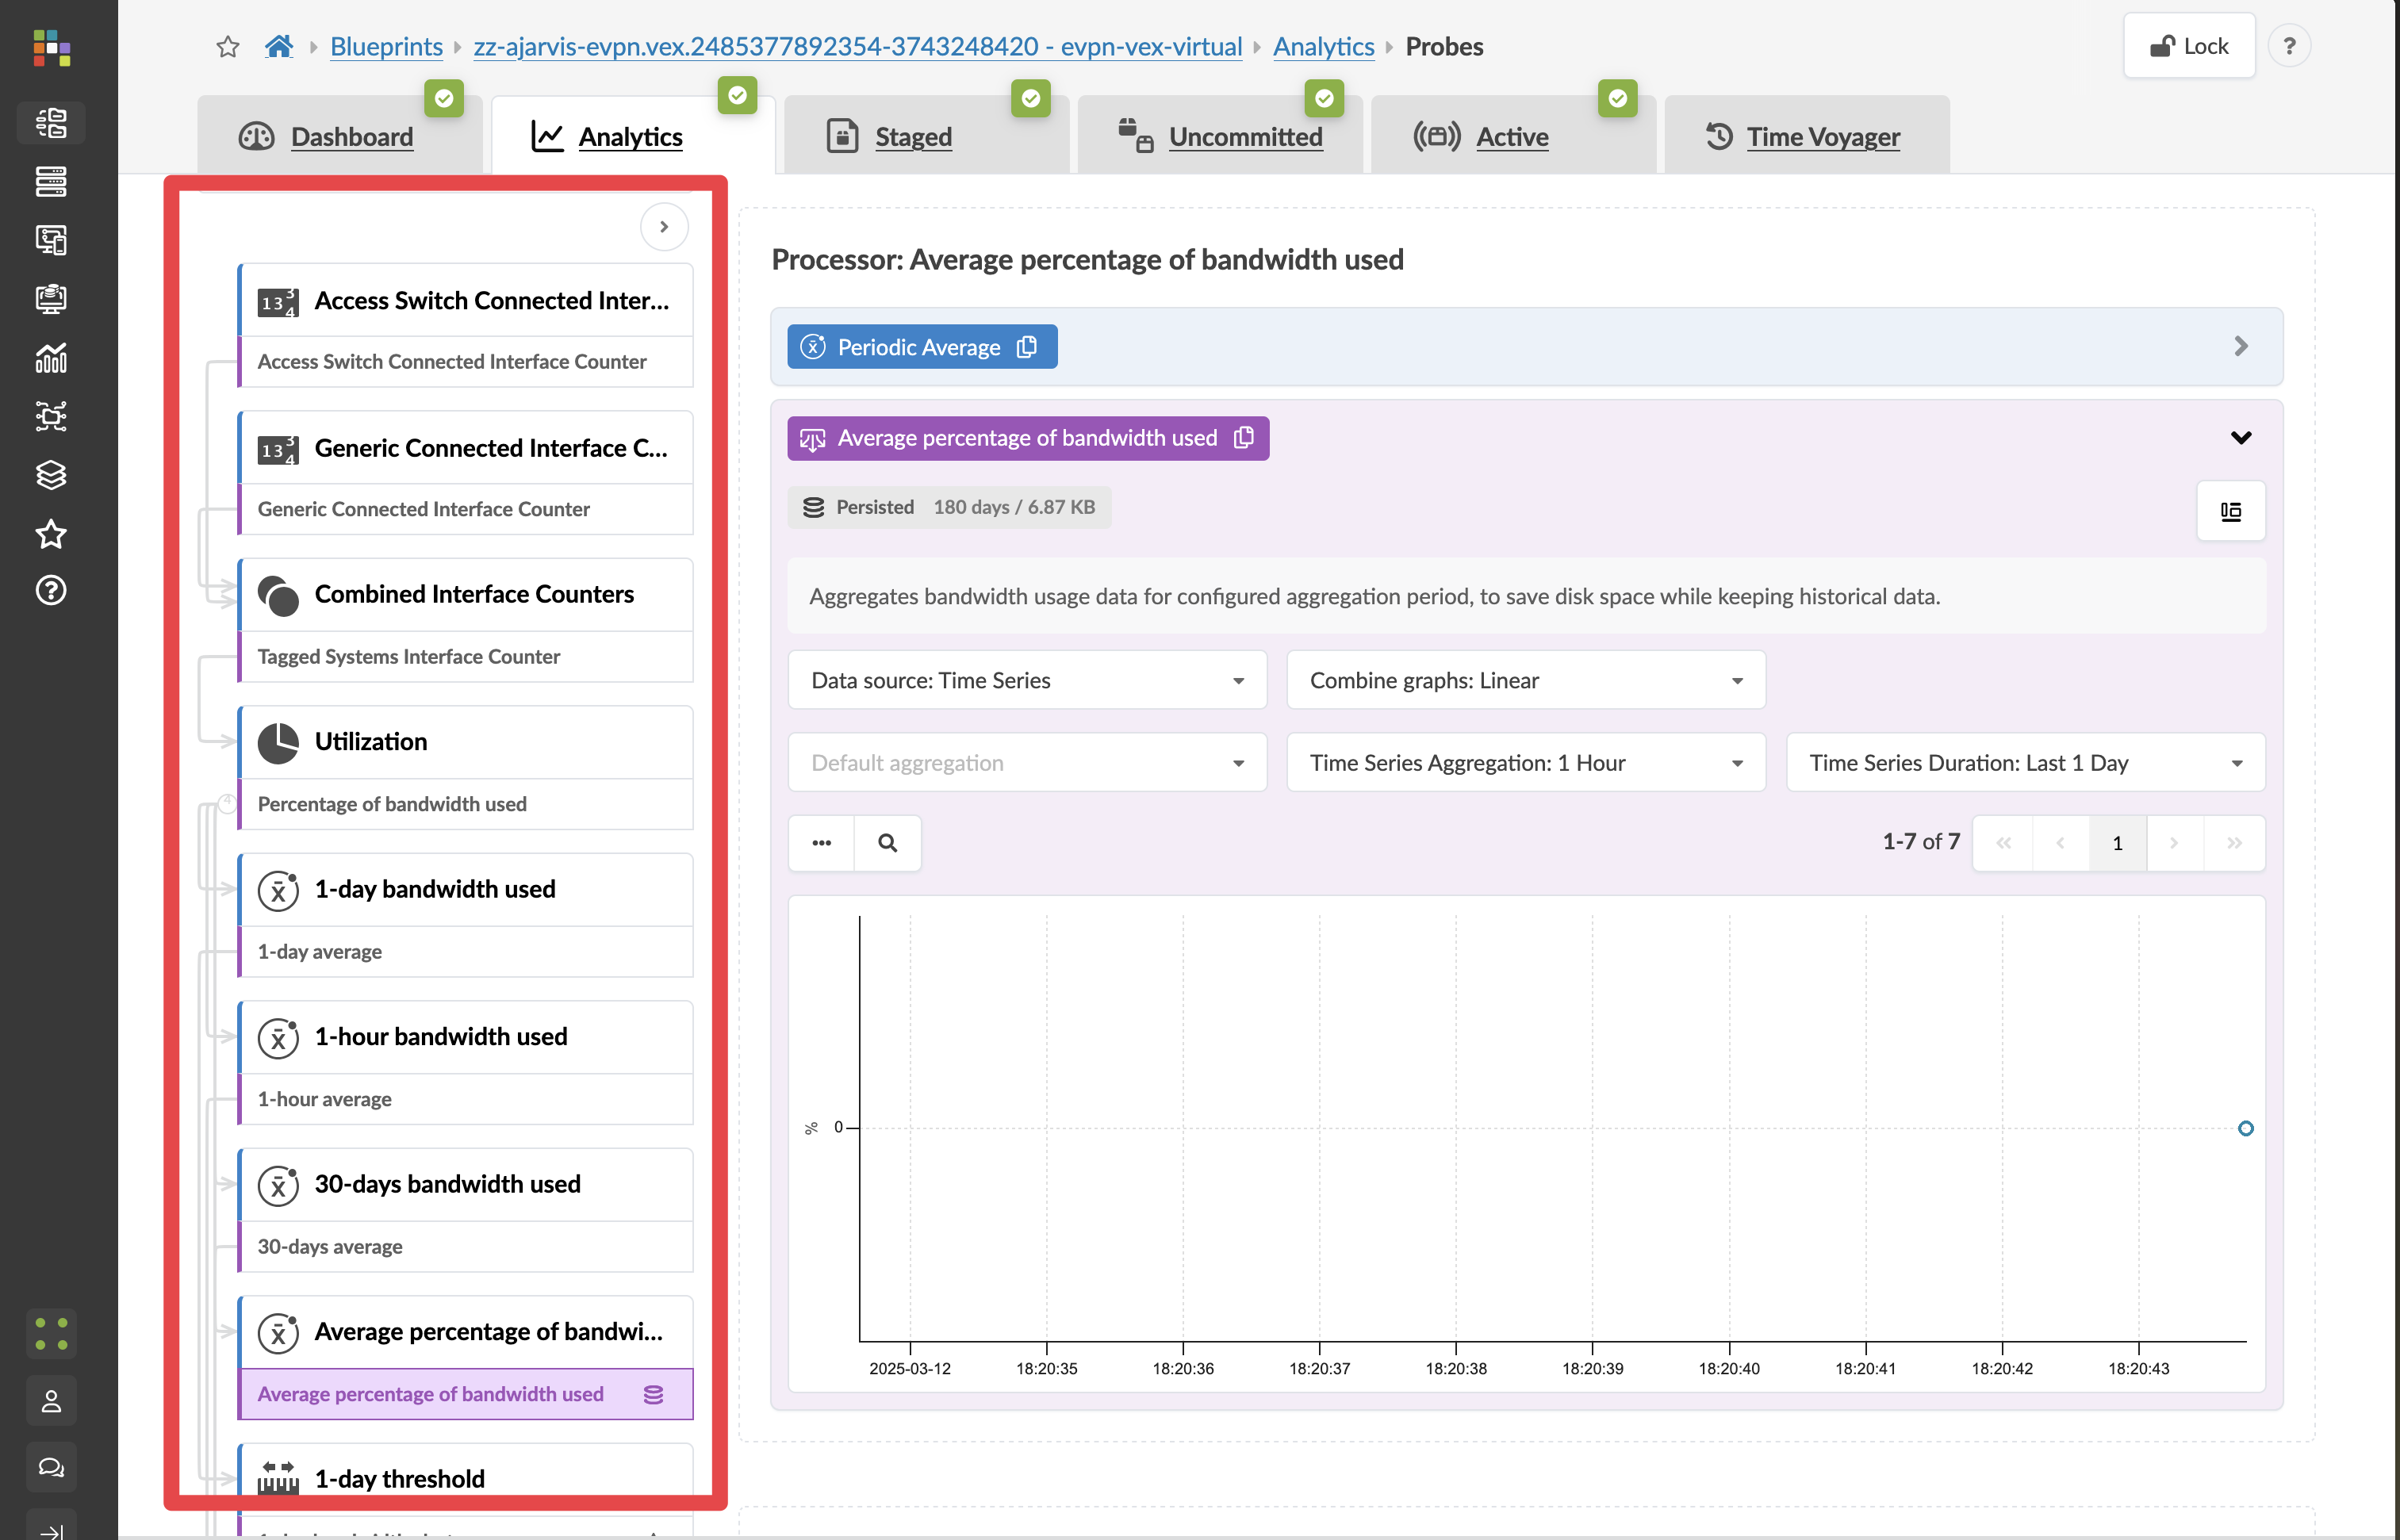
Creating Custom Probes and Dashboards
While Apstra comes with a comprehensive set of built-in and predefined probes, its true power lies in the ability to create custom probes and dashboards tailored to your specific needs.
Custom Telemetry Collection
Apstra allows you to collect and analyse virtually any data available from your network devices:
-
Collectors - Specify exactly what data to gather from devices
-
Processors - Define how to process and analyse the collected data
-
Anomaly Detectors - Set thresholds for when to generate alerts
Examples of custom telemetry you might collect include:
-
TCAM resource utilisation
-
MAC address table growth
-
Specific QoS queue statistics
-
Custom SLA metrics
-
Protocol-specific counters
-
Memory and CPU utilisation patterns
Building Custom Dashboards
Once you’ve created custom probes, you can visualise their data in customised dashboards:
-
Add widgets showing data from your custom probes alongside built-in analytics
-
Organise metrics in ways that are most meaningful for your operations team
Adaptive Monitoring
The most powerful aspect of Apstra’s custom analytics is that they automatically adapt as your environment changes:
-
Environment Growth: When you add new racks, devices, or virtual networks, your custom probes automatically extend to monitor these new components
-
Environment Reduction: When elements are removed, your analytics automatically adjust without generating false positives
-
No Explicit Interaction Required: This adaptation happens without any manual reconfiguration of your monitoring system
Real-World Applications
Custom probes and dashboards enable countless practical applications:
-
Security Monitoring: Track anomalous patterns that might indicate security threats
-
Capacity Planning: Monitor growth trends to anticipate upgrade needs
-
Compliance Verification: Ensure network configurations meet regulatory requirements
-
Service Level Monitoring: Track performance against defined SLAs
This unparalleled flexibility ensures that your monitoring system grows and evolves alongside your network, providing continuous visibility without ongoing maintenance overhead. As your network changes, your custom analytics automatically adjust to provide relevant, contextual insights throughout your fabric’s lifecycle.
The Power of Contextual Monitoring
What makes Apstra’s monitoring truly powerful is that it’s not a separate system - it’s integrated with your intent model. This means:
-
Automatic adaptation: As your network changes, monitoring adapts automatically
-
Relevant context: Anomalies are presented with full context of your design intent
-
Reduced noise: You only see alerts for true deviations from intent, not normal operations
-
Historical comparison: You can track how metrics evolve over time against your intent
This ensures that your monitoring is always aligned with your current network design and only alerts you to actual issues that require attention.
What You’ve Learned
You’ve now seen how Apstra’s Intent-Based Analytics provides:
-
Closed-loop validation that your network matches your design intent
-
Context-aware monitoring that understands your network’s purpose
-
Flexible analytics options from built-in to fully customisable
-
Automatic adaptation as your network evolves
This completes our exploration of Day 2 operations in Apstra, from expanding your network to monitoring its health. You’ve seen how Apstra transforms complex networking tasks into simple, intent-driven operations that save time and reduce risk.