Lab Guide 1 - Juniper
Day 2 Operations: Monitoring with Intent-Based Analytics
The Power of Context-Aware Monitoring
Now that we’ve built our Analytics service, let’s examine one of Apstra’s most powerful capabilities: Intent-Based Analytics (IBA). Unlike traditional monitoring, which is often an afterthought in network deployments, monitoring in Apstra is fundamental to the system and stays in lockstep with your network as it evolves.
Understanding Closed-Loop Validation
Apstra operates on a principle of closed-loop validation - a transformative approach to network monitoring that fundamentally changes how you ensure network health.
|
Traditional Monitoring vs. Apstra’s Approach In traditional monitoring systems:
With Apstra’s Intent-Based Analytics:
|
This contextual understanding is only possible because Apstra knows the full context of your network - all physical and logical elements, interfaces, virtual networks, BGP peerings, and how they should behave according to your design intent.
Navigating the Monitoring Features
Apstra offers two primary monitoring views, each serving a different purpose:
The Main Dashboard
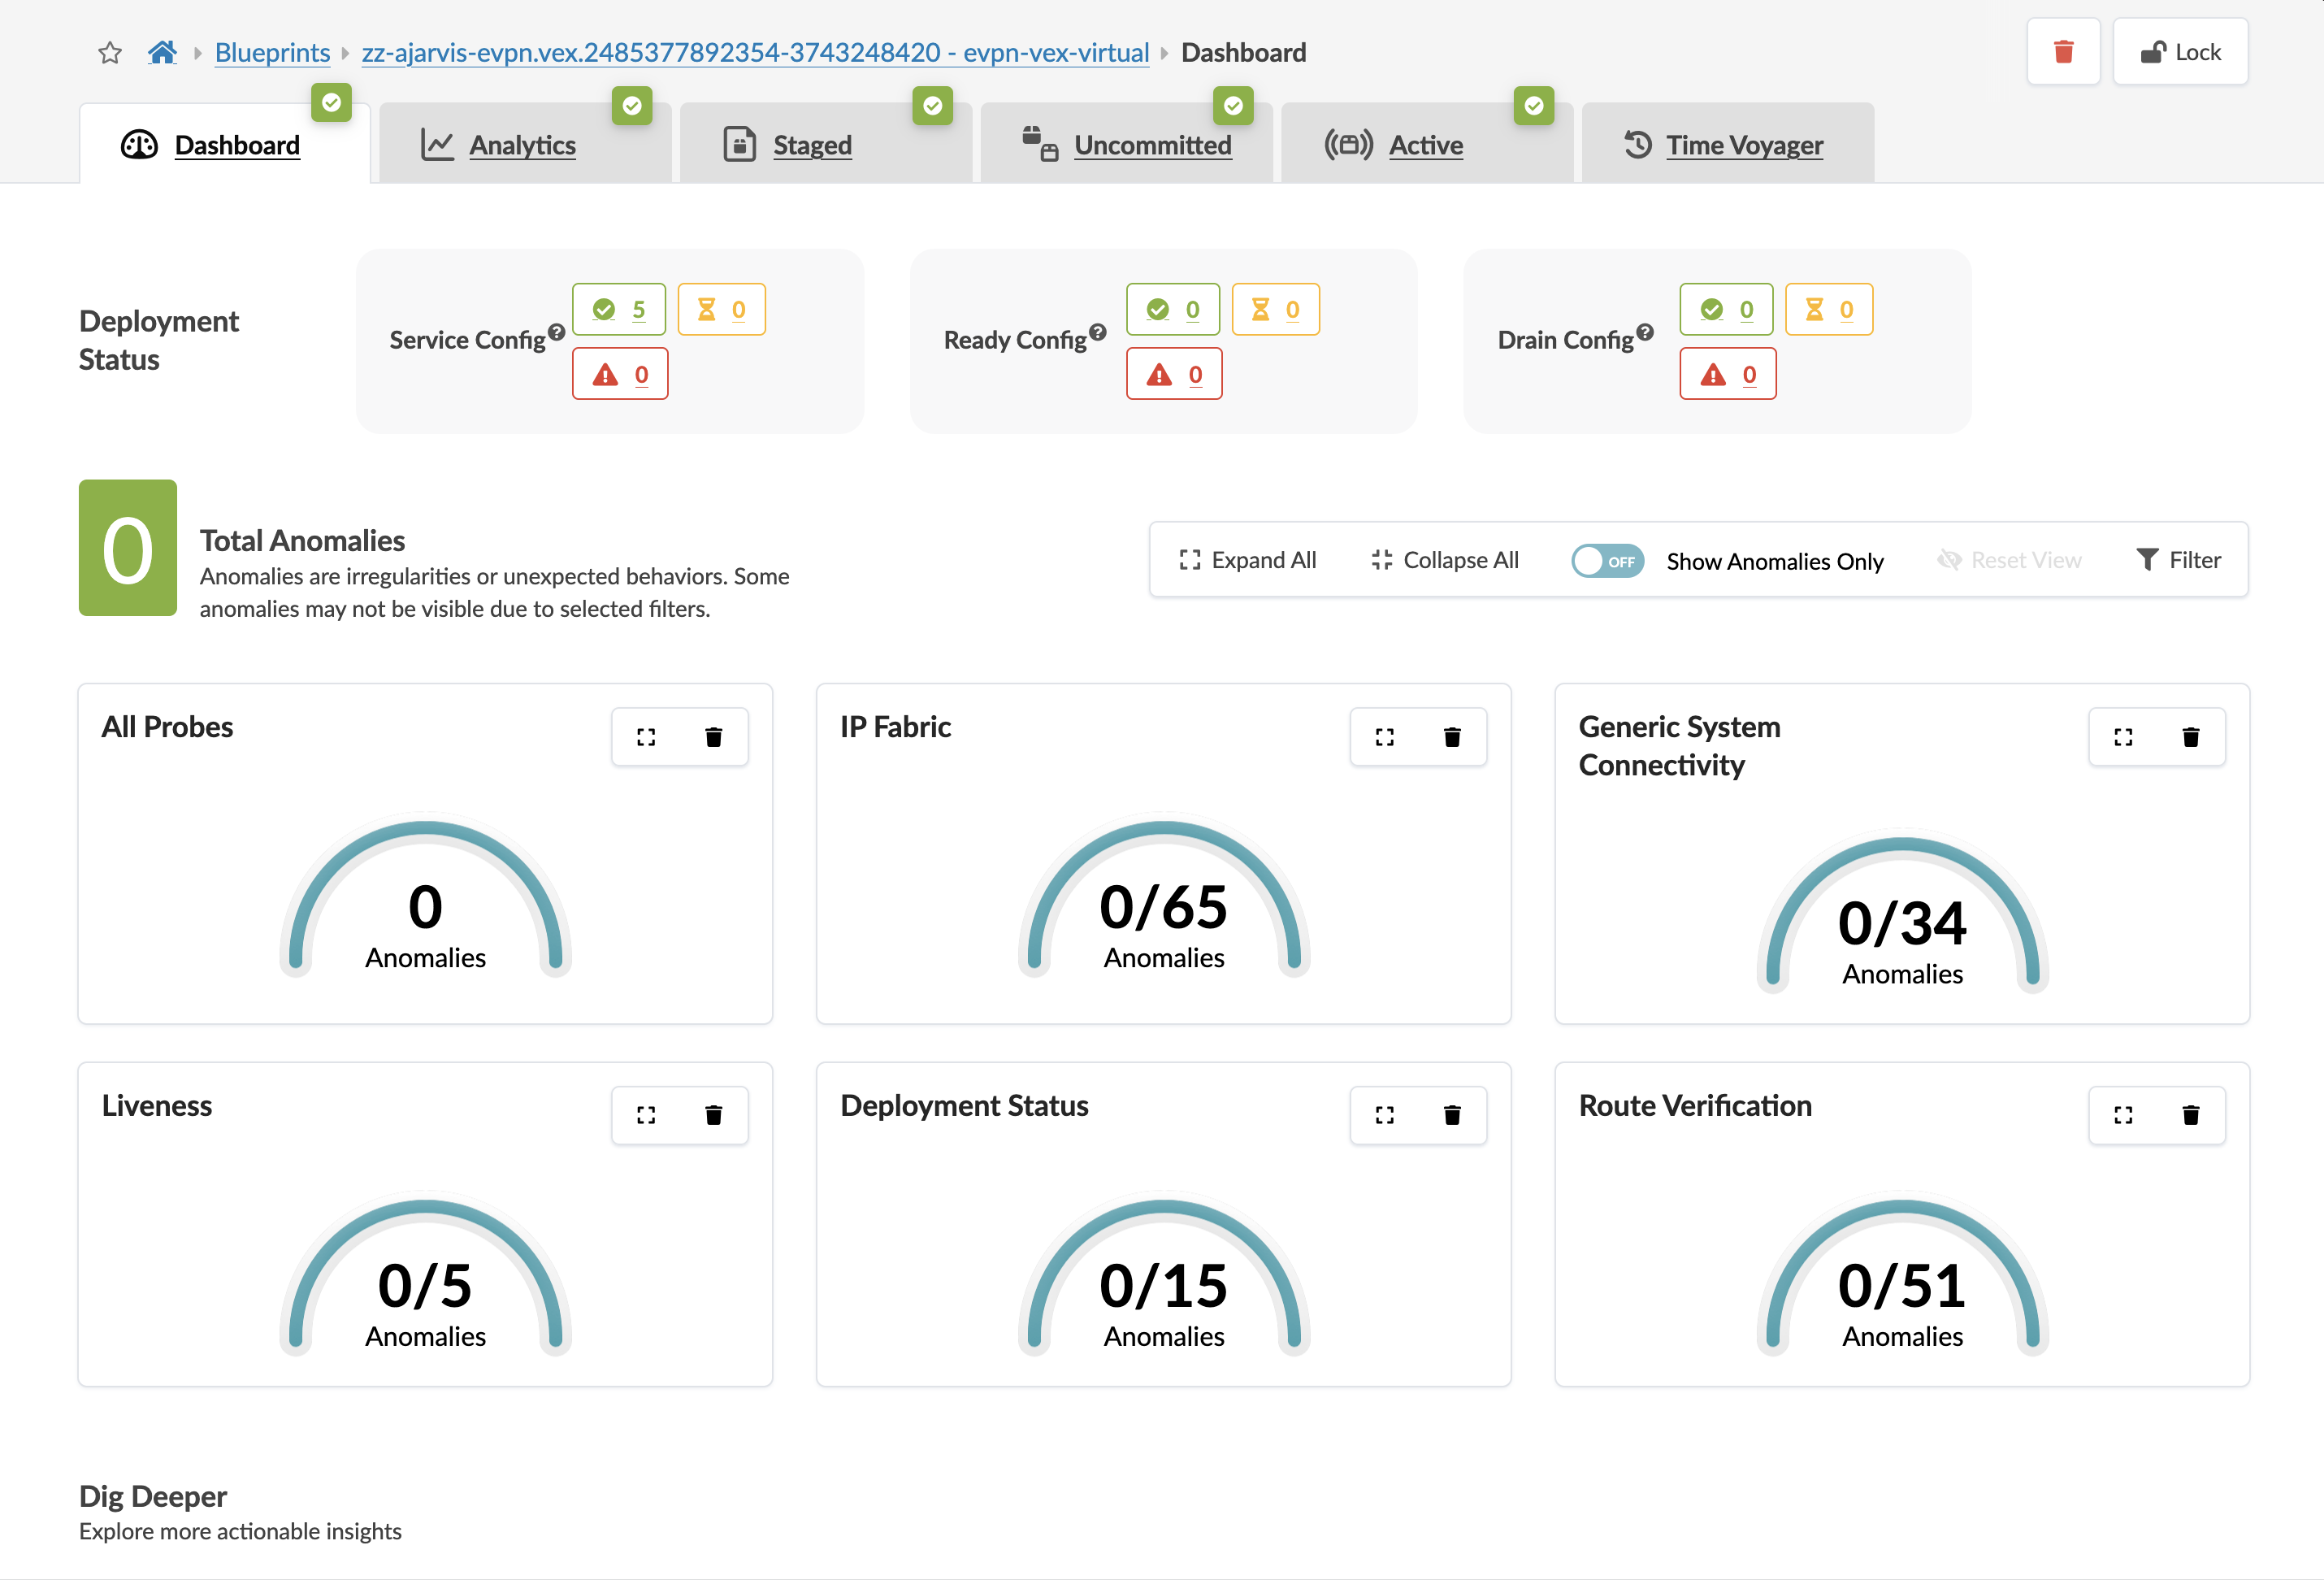
Navigate to the main dashboard of your blueprint:
-
This dashboard shows you immediate issues affecting the fabric
-
It presents a high-level health status of your network
-
It focuses on anomalies that require attention to maintain proper operation
-
Think of this as your "operational health" view - what needs attention now

The Analytics Dashboard
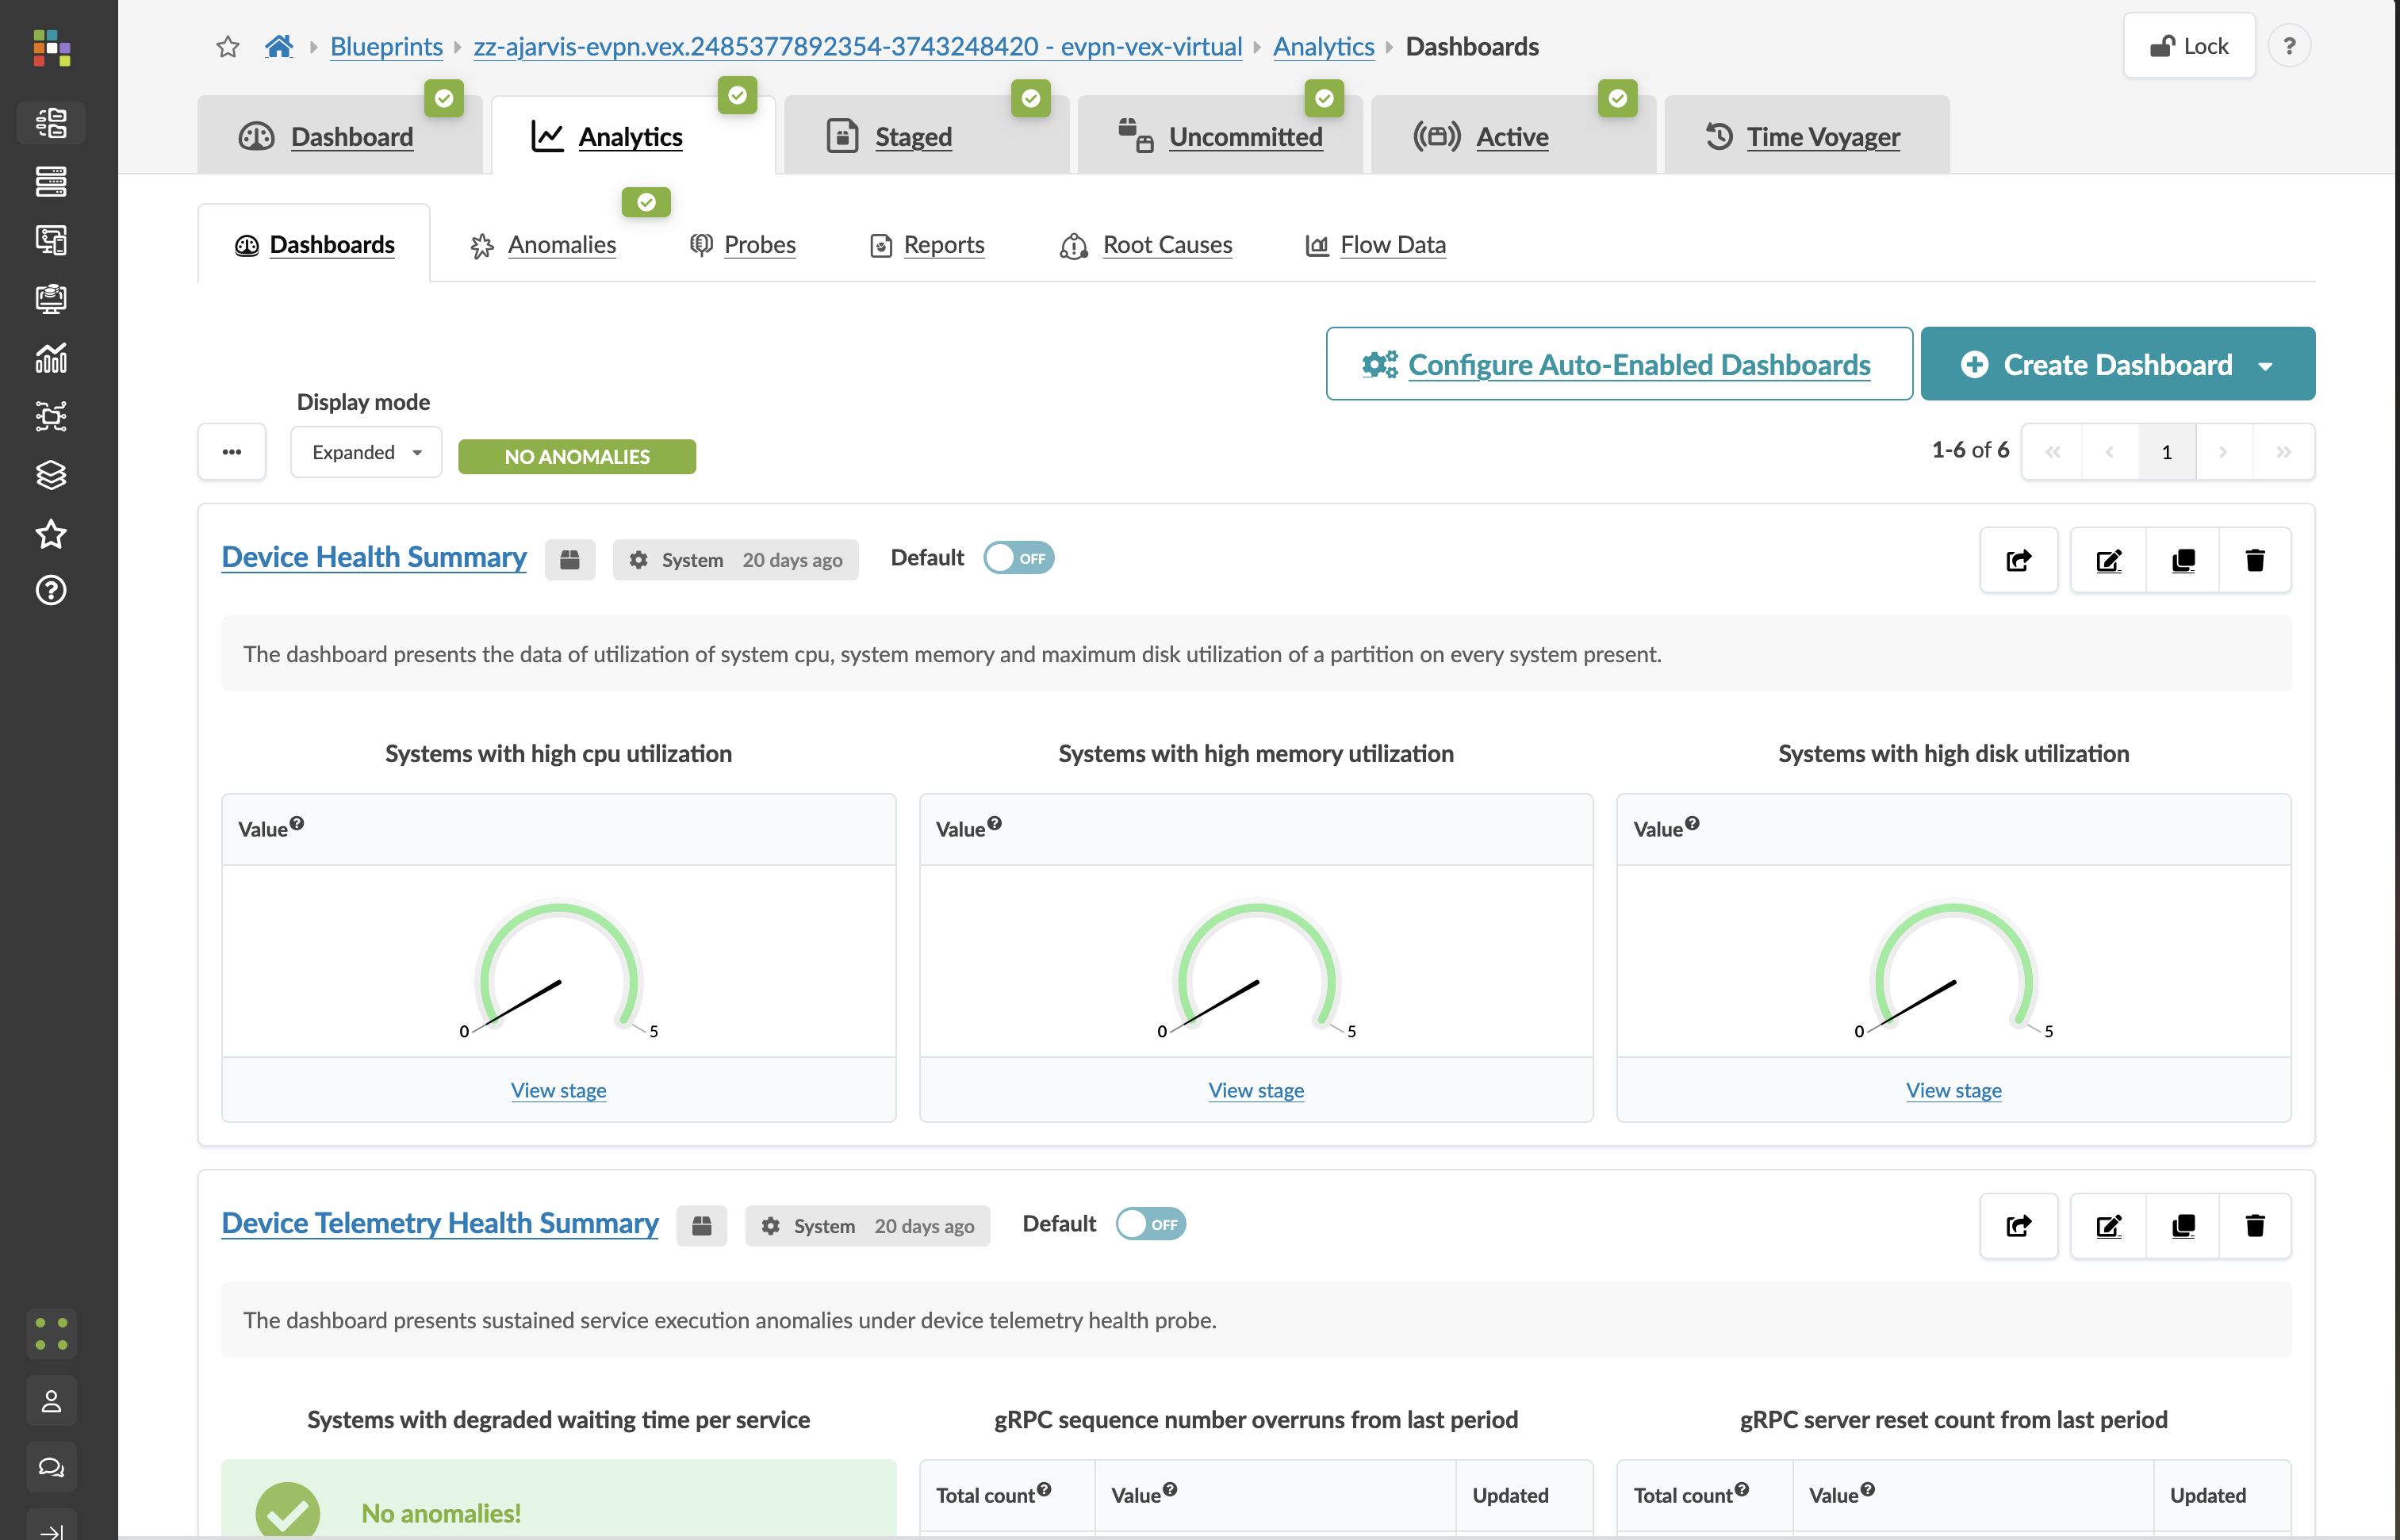
Navigate to Analytics in your blueprint:
-
This dashboard focuses on how your network is performing
-
It presents detailed telemetry data about various aspects of your fabric
-
It allows you to track trends, patterns, and potential issues before they become problems
-
Think of this as your "performance and compliance" view - how things are trending
Intent-Based Analytics Components
Apstra’s IBA system consists of three main components:
-
Built-in Detections: Always running, these detect fundamental issues like configuration deviations, unreachable devices, and link flaps.
-
Predefined Probes: Ready-to-use analytics that you can instantiate to monitor specific aspects of your network, such as:
-
Interface error rates
-
Packet discard percentages
-
BGP session stability
-
Interface bandwidth utilisation
-
-
Custom Telemetry Collection: For ultimate flexibility, you can create custom analytics to collect and visualise any data available from your switches.

Let’s look at how to instantiate a predefined probe to monitor our network.